- As the recent breakdown of the UK Gilt market illustrates, policymakers face an increasingly difficult trade-off between combating inflation, supporting economic growth and maintaining financial stability. With core bond and currency markets facing very high volatility and worsening liquidity conditions, we think the risk that central banks have to step in again to prevent a destabilising cycle of panic selling and money market distress has risen, even if that would clash with plans to tighten monetary policy further.
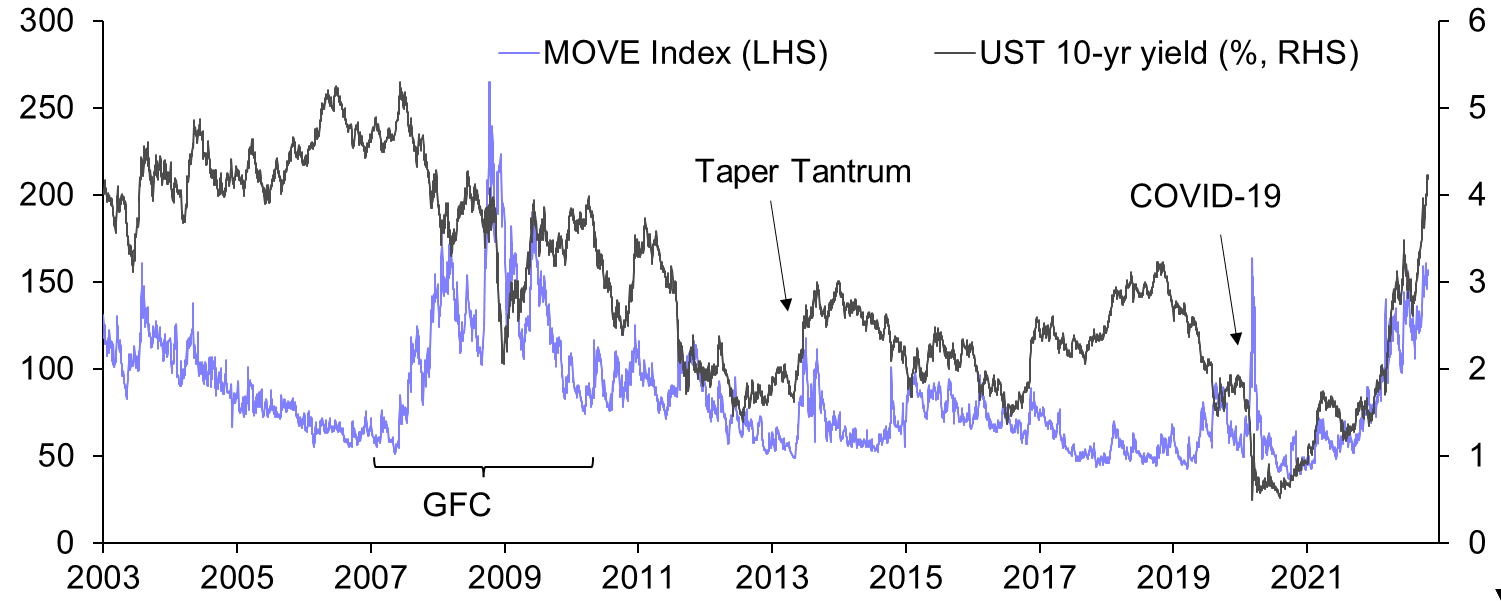
- Although most measures of core money market stability have remained in relatively benign territory since we published our last Financial Market Stress Monitorin late May, both realised and implied volatility in key bond and currency markets have continued to rise and are approaching worrying levels. (See Chart 1.) The BoE and the ECB have already been forced to shore up their government bond markets, while the BoJ, the PBOC, and several other Asian central banks appear to be intervening in foreign exchange markets to limit the pace and extent of their currencies’ depreciations against the dollar. In the US, there is speculation that the Treasury may institute a “buyback” programme to improve government bond market liquidity.
- In other words, in Europe and, to a lesser extent, the US, preserving financial stability appears increasingly at odds with fighting inflation (and entirely incompatible with the sort of fiscal stimulus briefly contemplated in the UK). And the Fed’s aggressive policy tightening is causing difficulties for economies where underlying growth and inflation dynamics are less robust. The FOMC may still be able to thread the needle between tightening financial conditions enough to cool down the US economy and slow inflation but not so much as to destabilise financial markets and the global economy. But the balancing act is getting tougher.
- Core money markets have held up well despite ongoing financial volatility and economic uncertainty.
- Volatility in core bond and currency markets is unusually high, and liquidity conditions have worsened.
- Banking sector equities have fallen further; perceived credit risk has risen to the highest level since 2013.
- CDS premia of core DM sovereigns have risen and euro-zone periphery markets remain under pressure.
- The risks arounds some EM sovereigns have continued to rise, in several cases into distressed territory.
|
Chart 1: BofAML MOVE Index Of Option-Implied Volatility & 10-Year US Treasury Yield |
|
|
|
Sources: Refinitiv, Capital Economics |
United Kingdom
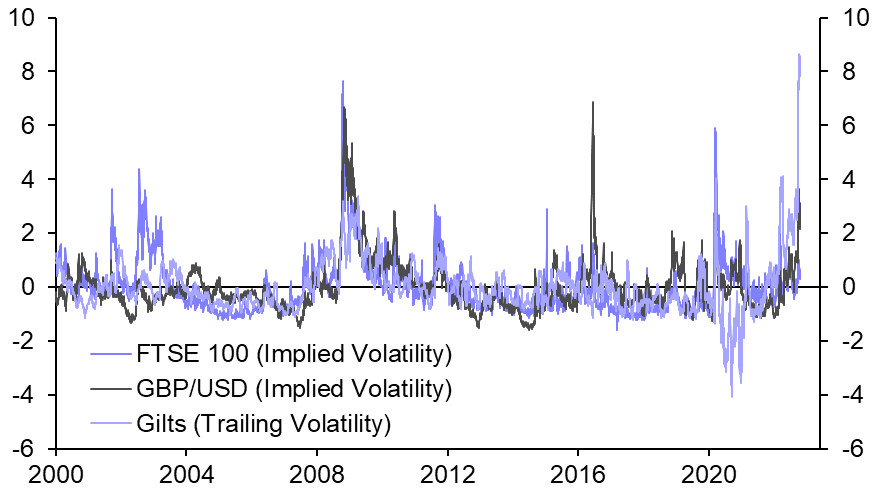
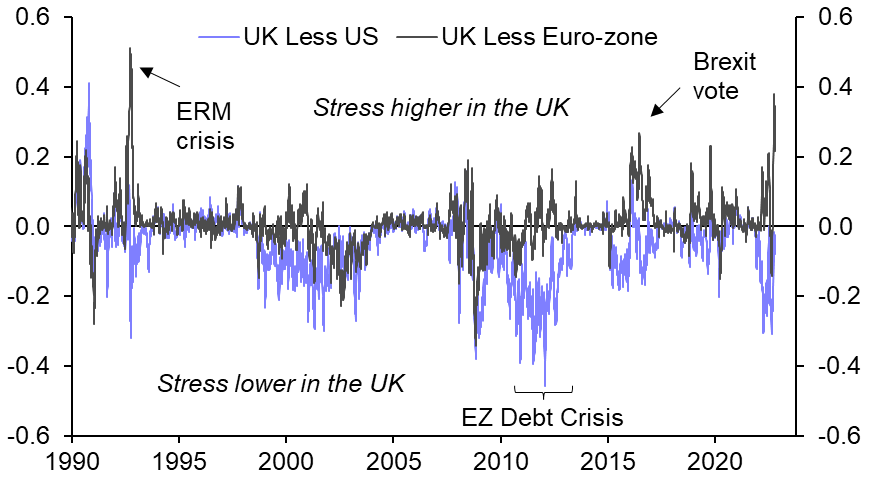
- UK financial markets have gone through a month of extreme volatility (2). Although that volatility started to rise once it became clear that Liz Truss was likely to become Prime Minister, probably in part due to perceived risks around her fiscal approach, it only really surged following the “mini-budget” on 23rd September. That pushed the ECB’s systemic stress indicator for the UK to its highest level relative to the US measure since the ERM crisis (3), and broadly in line with the equivalent euro-zone measure.
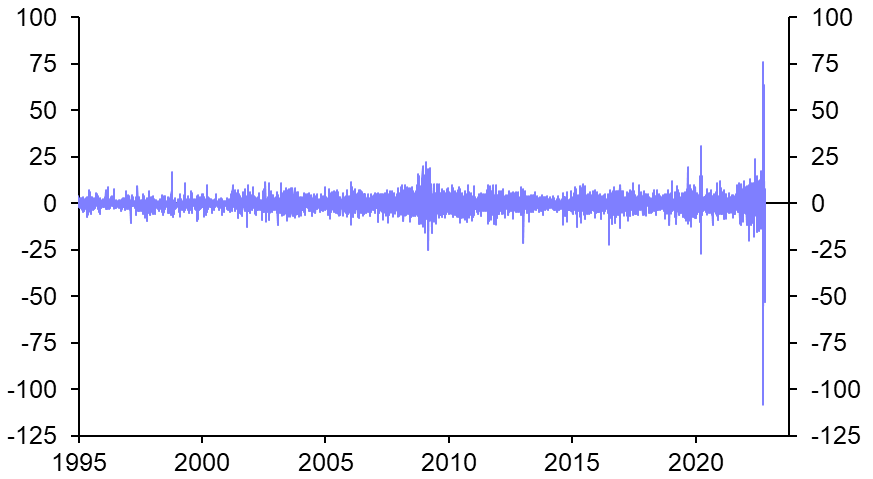
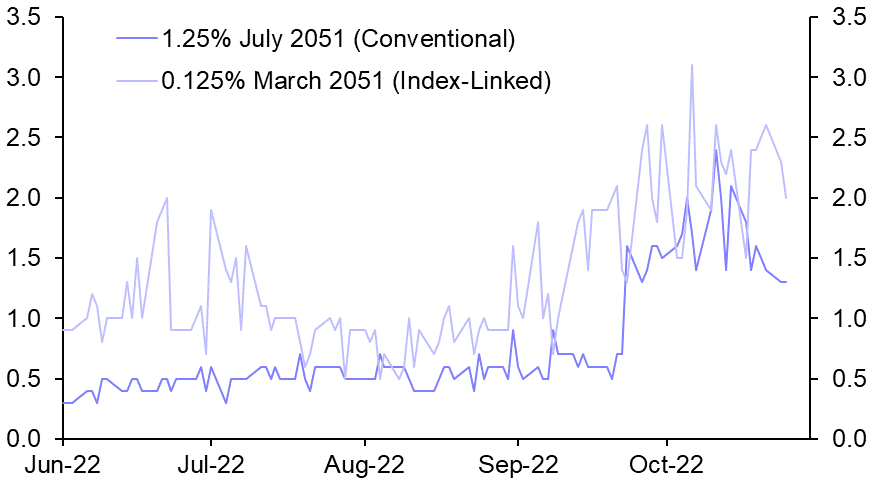
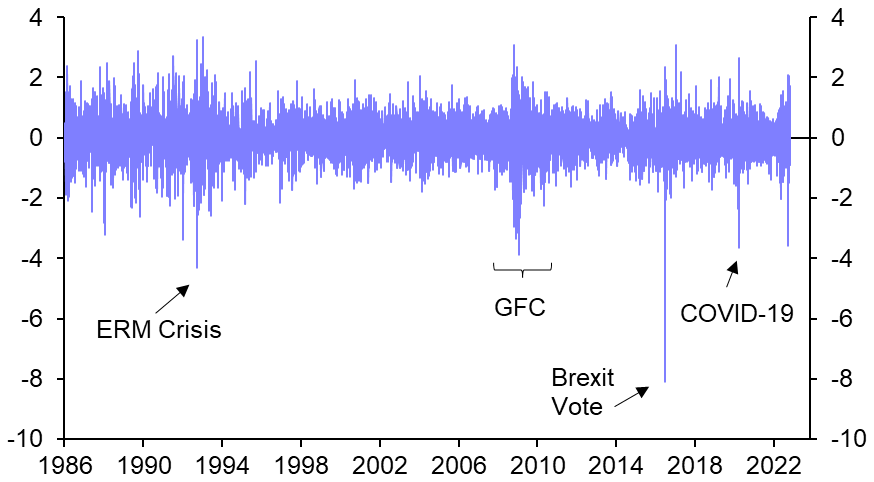
- The Gilt market was at the centre of the volatility in the UK, especially at longer maturities. The 30-year Gilt yield saw daily swings orders of magnitude larger than on any day since at least the early 1990s (4), in part due to the liquidity problems of so-called liability-driven investment mechanisms used by pension funds that hold a large share of long-term Gilts. While volatility (and bond yields) have dropped back after an abrupt policy U-turn (and the resignations of Kwasi Kwarteng and Liz Truss), liquidity conditions still appear worse than before the mini-budget, as evidenced by, for example, wider bid/ask spreads (5).
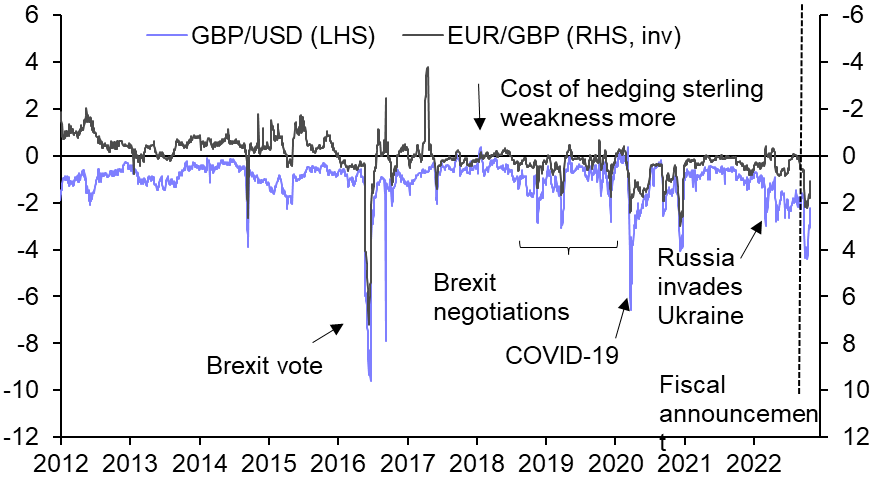
- The pound also saw a surge in volatility (6). 3-month risk reversals suggest a substantial risk premium emerged in sterling, which is still far from subsiding (7). Given the ongoing political chaos in the UK, it wouldn’t be surprising if some residual risk premia was baked into some UK assets for some time yet.
|
Chart 2: 30-Day Implied/Trailing Volatility (Std Devs) |
Chart 3: ECB Composite Indicators Of Systemic Stress |
|
|
|
|
Chart 4: 30-Year Gilt Yield 1-Day Changes (bp) |
Chart 5: UK Conventional & Index-Linked |
|
|
|
|
Chart 6: GBP/USD 1-Day Changes (%) |
Chart 7: 1-Month 25-Delta Risk Reversals (pp) |
|
|
|
|
Sources: Refinitiv, Capital Economics |
Money Markets
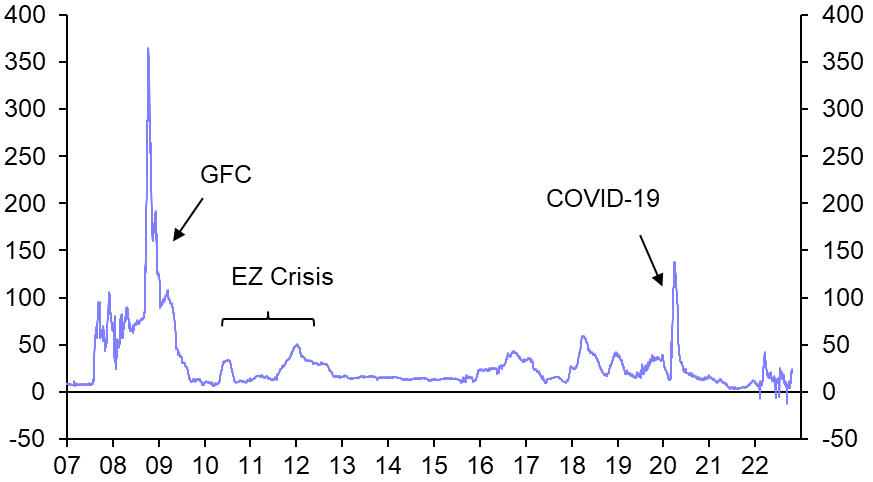
- Core money markets have remained relatively calm despite the worsening outlook for the global economy and the extreme volatility in key bond and currency markets. Spreads between secured and unsecured lending rates remain lower than their brief spike around the start of the Russian invasion of Ukraine (8). Cross-currency basis swaps for the major currencies have also widened, but appear mainly to reflect the usual year-end effects (9). The widening of the Swiss franc basis and the SNB’s use of its dollar swap line with the Fed appears to reflect arbitraging by some Swiss banks related to the SNB’s tiered reserve policy.
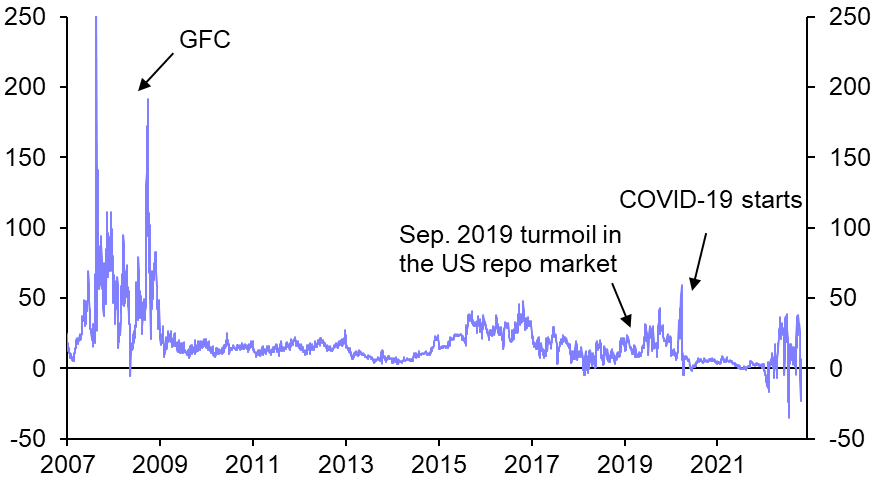
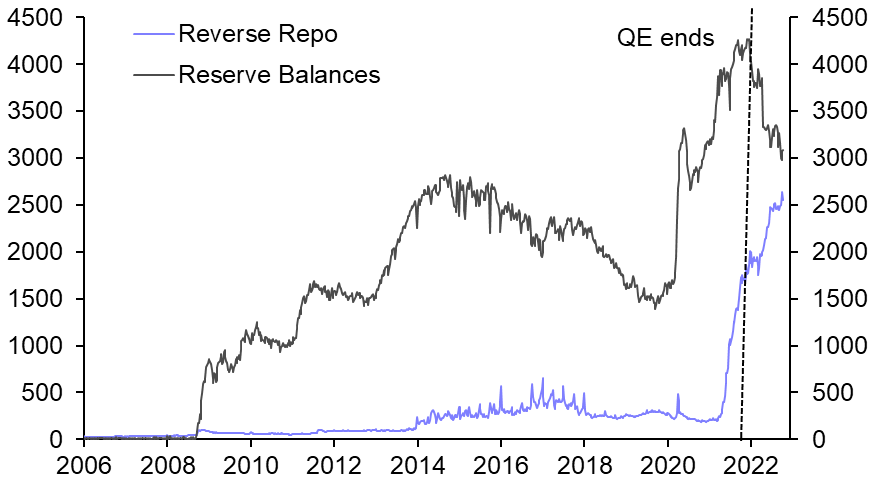
- The spread between the 3-month US repo rate and T-bill yield has remained volatile (10). In part, this may simply reflect the rapid increase in the US policy rate and ongoing high volatility in the Treasury market. The Fed’s reverse repo facility and the relative scarcity of T-bills also play a role: more than $2.2trn of cash that might otherwise be available in the private repo market now sits in the reverse repo facility, and the balance has continued to increase even as the Fed’s overall balance sheet has started to shrink (11).
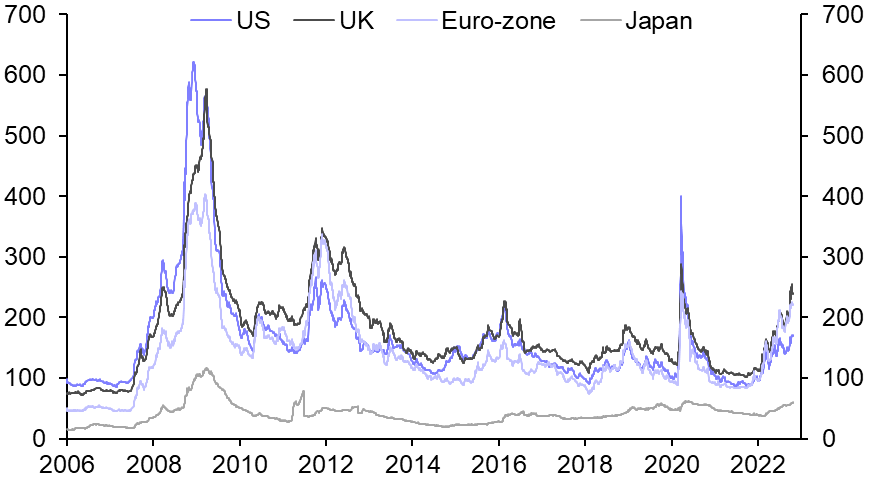
- Short-term corporate spreads in the major advanced economies have increased somewhat, but remain well short of crisis levels (12). The spreads of investment-grade bonds have also risen, especially in the euro-zone and the UK, where they are approaching levels only seen during recessions (13).
|
Chart 8: US 3M LIBOR - OIS Spread (bp) |
Chart 9: 3M Cross-Currency Basis Swaps Vs USD (bp) |
|
|
|
|
Chart 10: USD 3M Repo Rate – 3M T-Bill Yield (bp) |
Chart 11: Selected Fed Liabilities ($bn) |
|
|
|
|
Chart 12: 3M Yield Spreads Of Commercial Paper Over Gov’t Bonds (bp) |
Chart 13: OAS Of ICE BofA ML IG Corp. Bond Indices (bp) |
|
|
|
|
Sources: Refinitiv, Bloomberg, Capital Economics |
Market Liquidity & Volatility
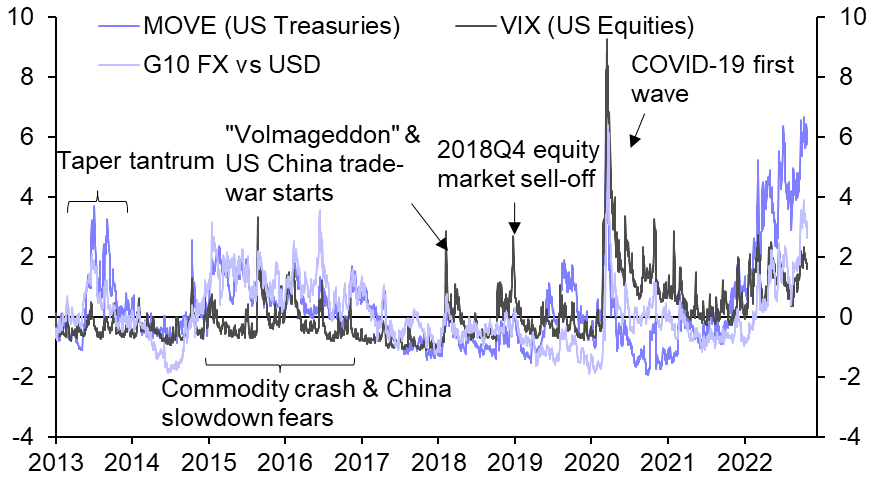
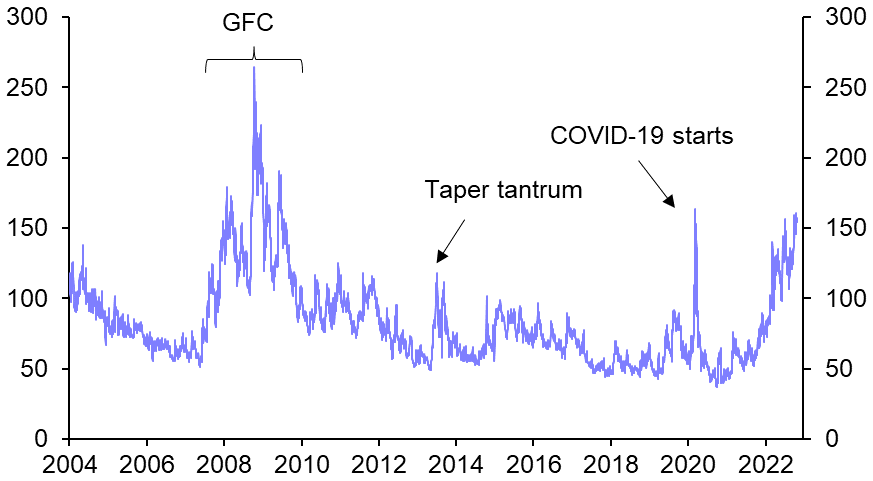
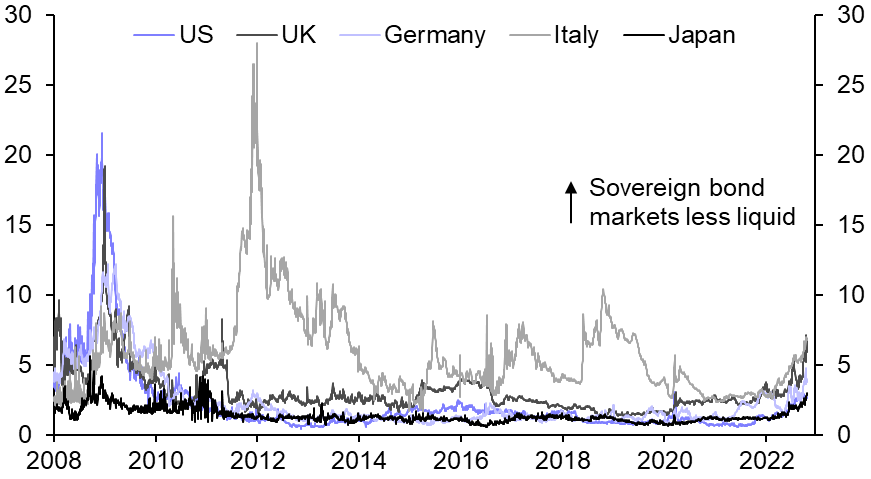
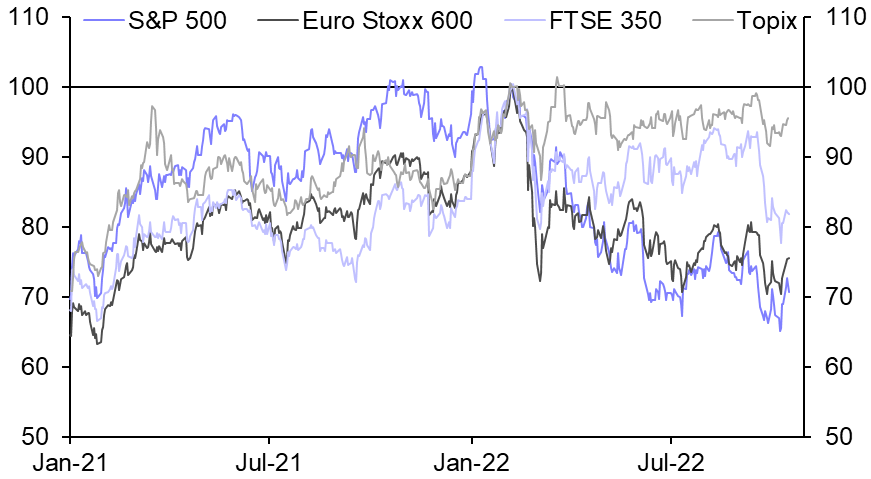
- Both realised and implied volatility is at very high levels across major bond and currency markets, although equity markets have been less affected (14). The MOVE Index of implied volatility of US Treasuries remains close to its peak in early 2020 and, unlike that spike, shows little sign of falling back so far (15). Liquidity in government bond markets has continued to deteriorate, sparking speculation that the US Treasury may announce a buyback programme for less liquid “off-the-run” bonds (a tool it last used in 2000-02) (16). In the UK, a breakdown in bond market functioning forced the BoE to intervene (see UK section).
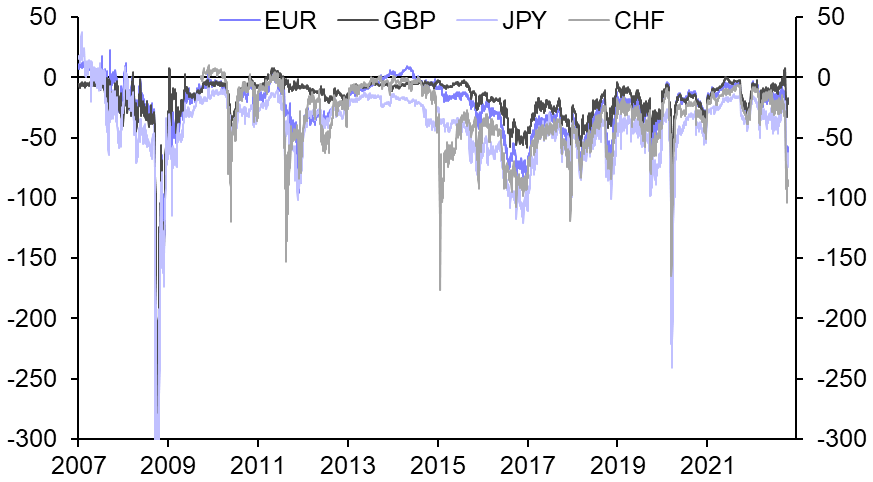
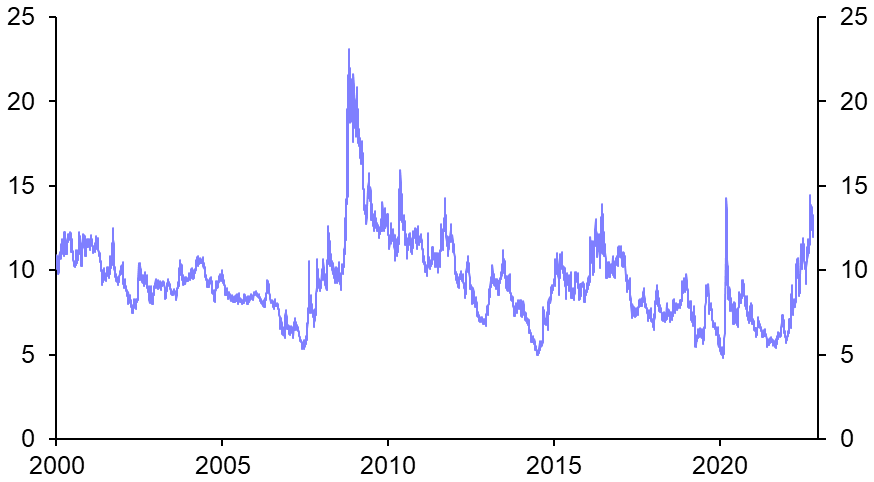
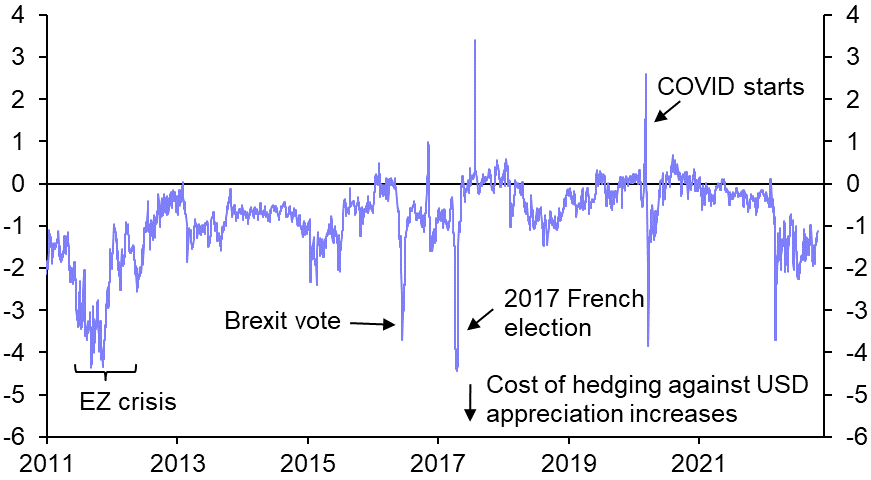
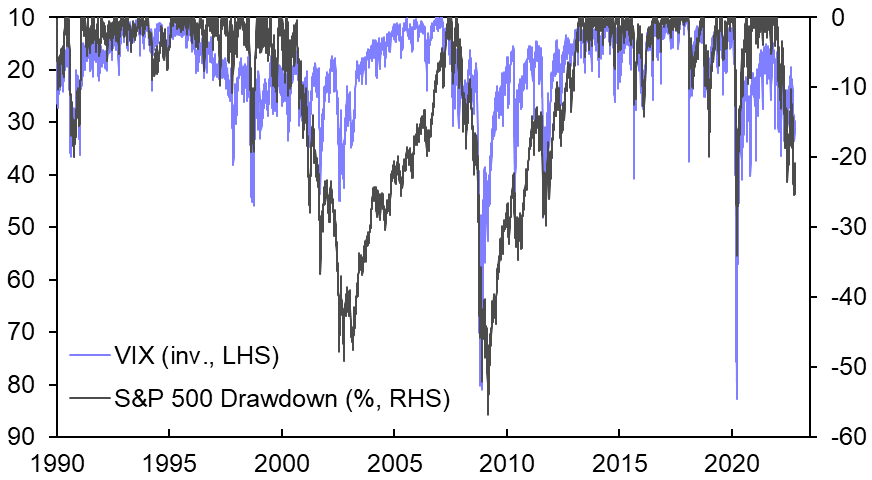
- Currency market implied volatility is also as high as it has been over the past two decades outside of the GFC (17). Risk reversals are also consistent with a view that risks are skewed heavily towards a further surge in the dollar, consistent with the worsening outlook for global economic growth and financial stability (18). Japan’s decision to intervene in support of the yen, for the first time since 1998, and efforts by several other Asian economies to prop up their currencies suggest policymakers are increasingly worried by the effects of the dollar’s continued rapid appreciation. By contrast, major equity markets have remained relatively orderly: the VIX Index has remained well below long way from its peaks in 2020 and 2008 (19).
|
Chart 14: Implied Volatility (Z-scores Since 2013) |
Chart 15: ICE BofA ML MOVE Index |
|
|
|
|
Chart 16: Bloomberg Government Bond Liquidity Indices |
Chart 17: Average 3M At-the-Money Implied Volatility Of EUR, JPY & GBP Vs USD (%) |
|
|
|
|
|
|
Chart 18: Average 3M 25-delta Risk Reversal Of G10 Currencies Vs USD (pp) |
Chart 19: S&P 500 Drawdown From Previous Peak & VIX Index |
|
|
|
|
|
|
Sources: Refinitiv, Bloomberg, Capital Economics |
||
Banks
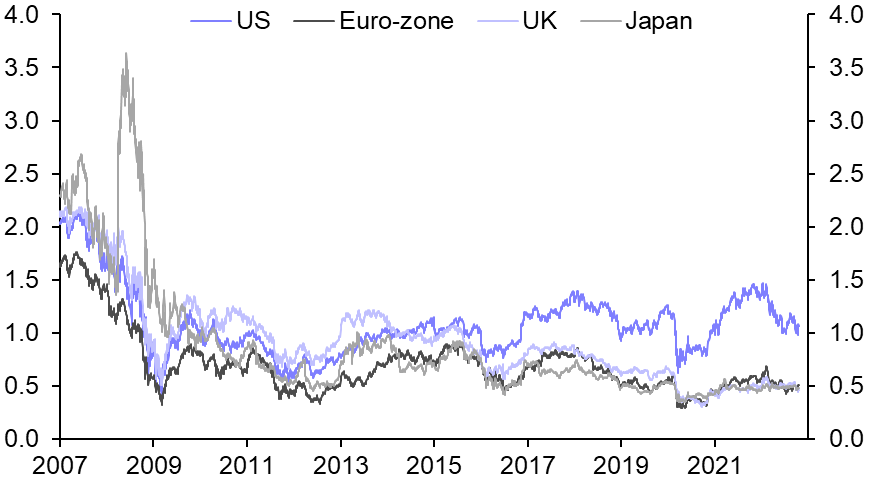
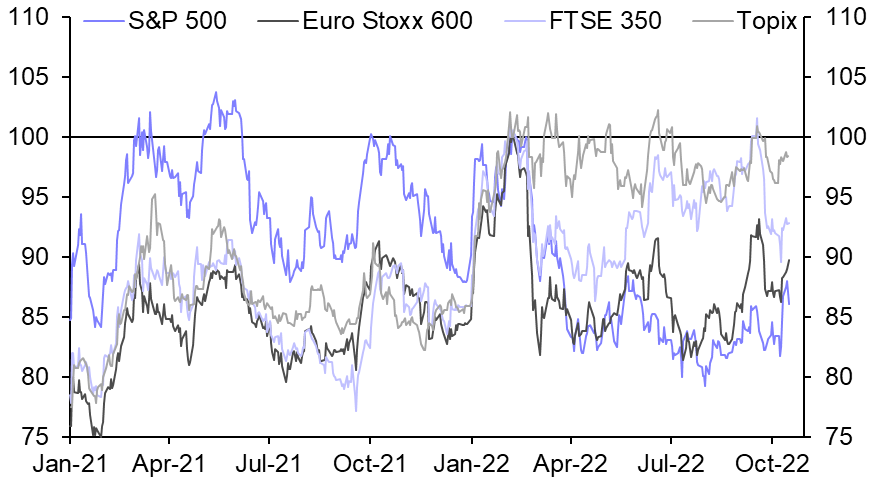
- Bank equities in most major economies have continued to struggle, as worries about an economic slowdown have intensified (20). Price-to-book ratios have also fallen, although they remain well above the lows reached in early 2020 (21). But bank equities have not underperformed the rest of the equity market since the immediate aftermath of Russia’s invasion of Ukraine – while credit losses are likely to increase in a downturn, higher long-term interest rates will probably improve most banks’ underlying profitability (22).
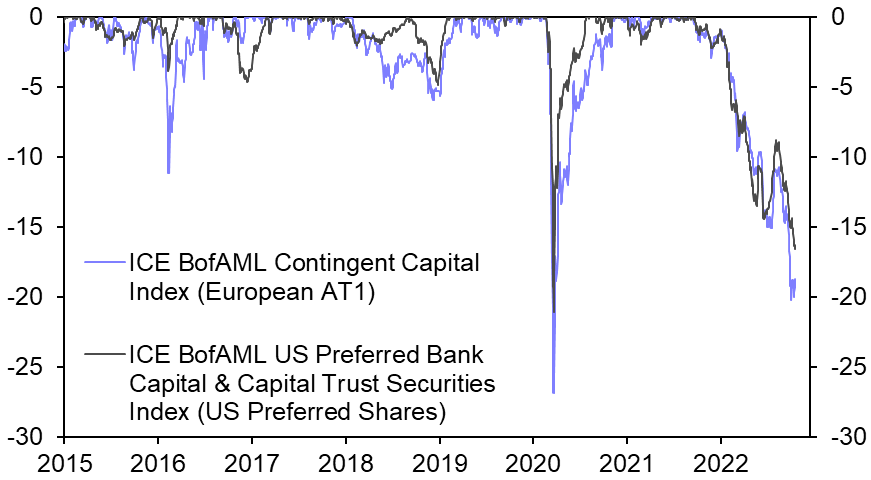
- Banks’ subordinated debt instruments have also seen their prices fall sharply (23). In large part this reflects the rise in underlying risk-free rates. But spreads have also widened, especially in Europe, as the perceived risk of capital ratios worsening enough to trigger conversion of subordinated instruments has increased.
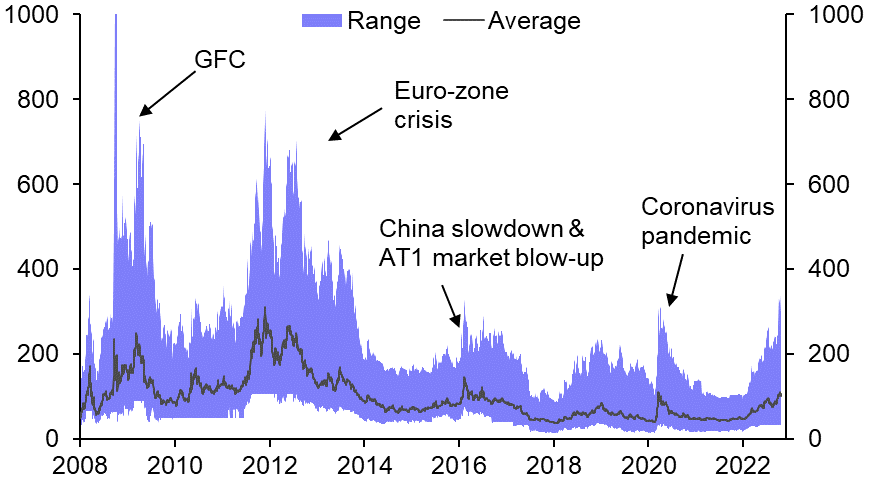
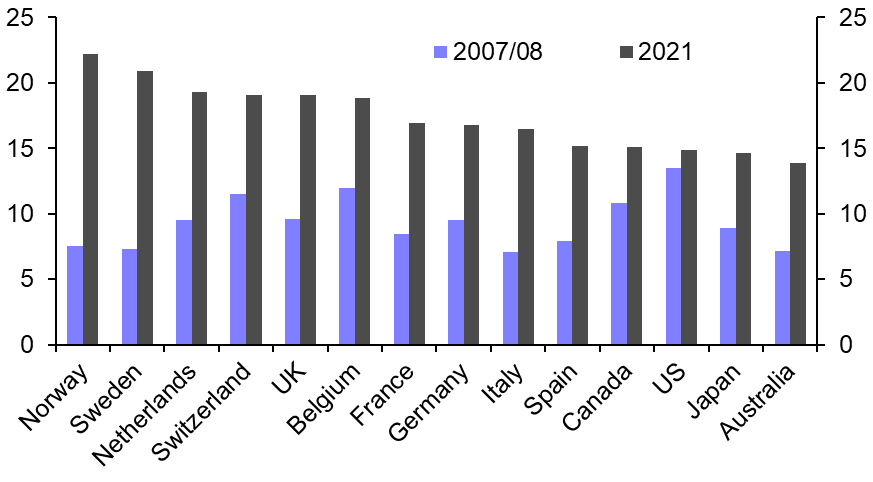
- Likewise, credit default swap (CDS) premia on the major global banks have risen (24). Indeed, among globally systemic banks both the average and maximum CDS price recently matched the levels seen in early 2016 and 2020. This appears, however, to reflect mainly concerns around the outlook for one or two major European banks struggling with persistent weak profitability and losses driven by idiosyncratic issues. As a whole, bank balance sheets have strengthened significantly over the past decade or so (25).
|
Chart 20: Bank Equity Indices (10th Feb. 2022 = 100) |
Chart 21: Price-To-Book Ratios (Simple Average Of Major Banks) |
|
|
|
|
Chart 22: Ratios Of Bank Equity Index To Overall Equity Index (10th Feb. 2022 = 100 |
Chart 23: AT1 & Preferred Share Indices, Drawdown From Peak (%) |
|
|
|
|
Chart 24: 5-Year CDS Premia On G-SIB Banks (bp) |
Chart 25: Tier 1 Capital (% Of Risk-Weighted Assets) |
|
|
|
|
Sources: Refinitiv, Capital Economics |
Developed Market Sovereigns
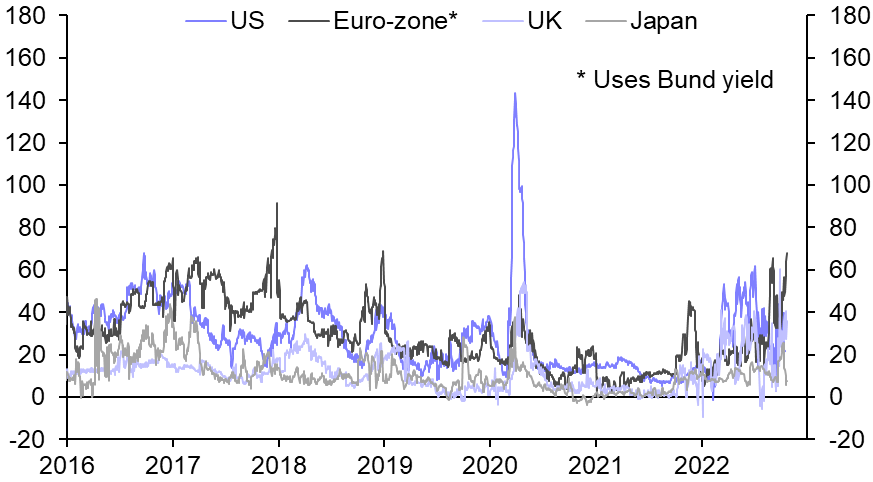
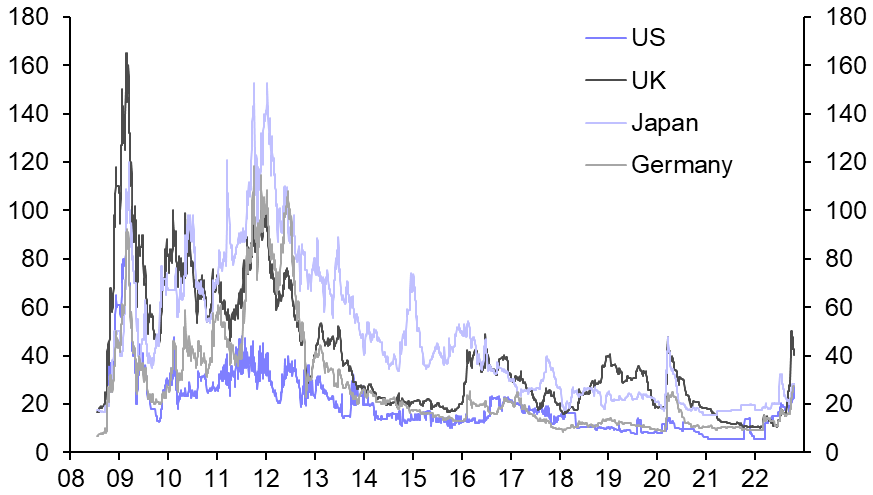
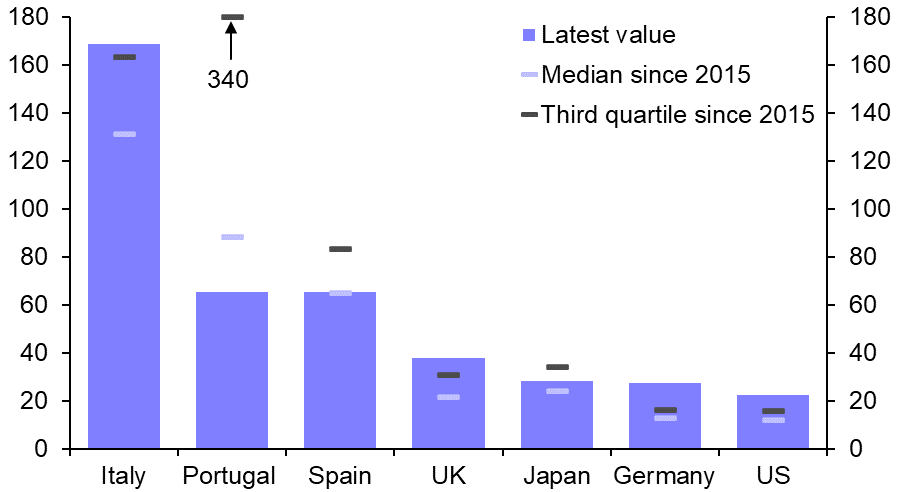
- Credit default swap premia on “core” DM sovereign debt have risen over the last few months. Aside from the UK (see earlier section), core CDS premia are still low compared to levels they reached during COVID-19 and the GFC (26), but in Germany and the US they are now in their top quartiles since 2015 (27).
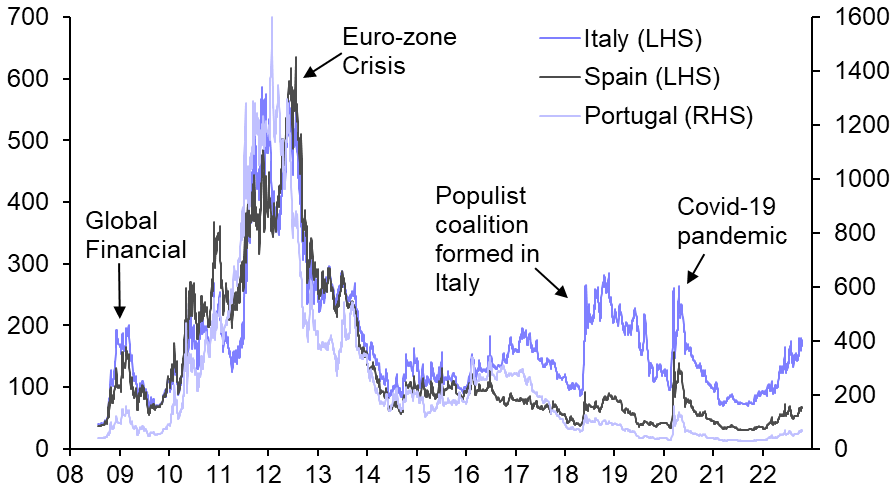
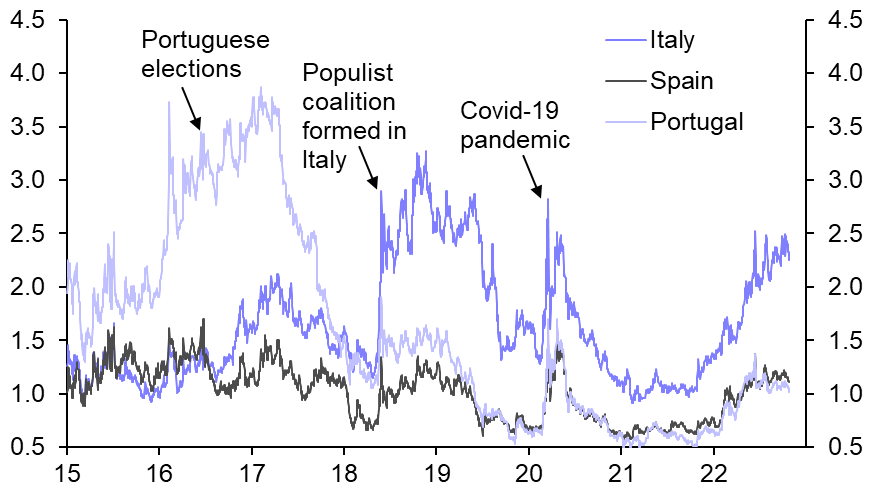
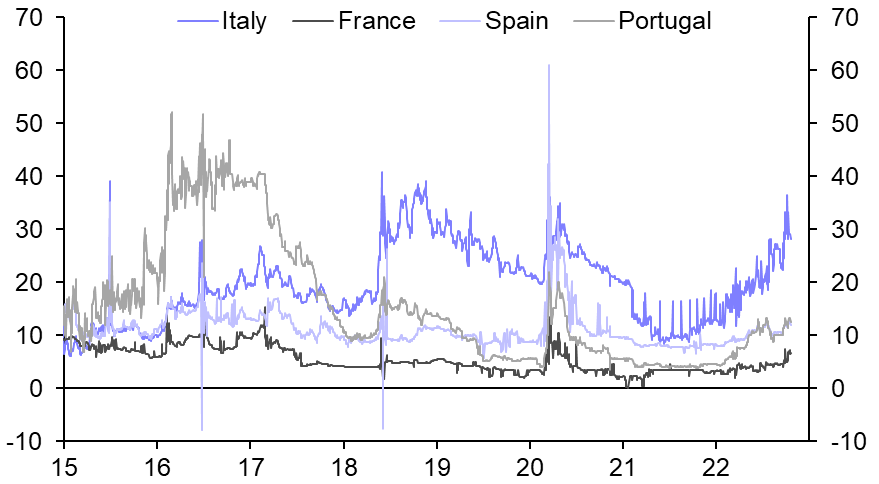
- In the euro-zone “periphery”, CDS premia have also continued to rise in Italy, but not in Spain and Portugal (28). In the former, they are now approaching their 2018 and 2020 highs, while in the latter two perceived risks remain low relative to post-euro-zone crisis periods of market stress. Meanwhile, yield spreads of 10-year peripheral sovereign bonds over equivalent German bonds have remained around the levels they reached in early June, when the ECB’s Governing Council called an emergency meeting to address the rise in periphery spreads (29). Given that core sovereign yields have risen significantly since, Italy has elected a new populist government and broader market strains have increased, this indicates that the ECB’s efforts are having some effect, though we continue to think that policymakers’ resolve will be tested further.
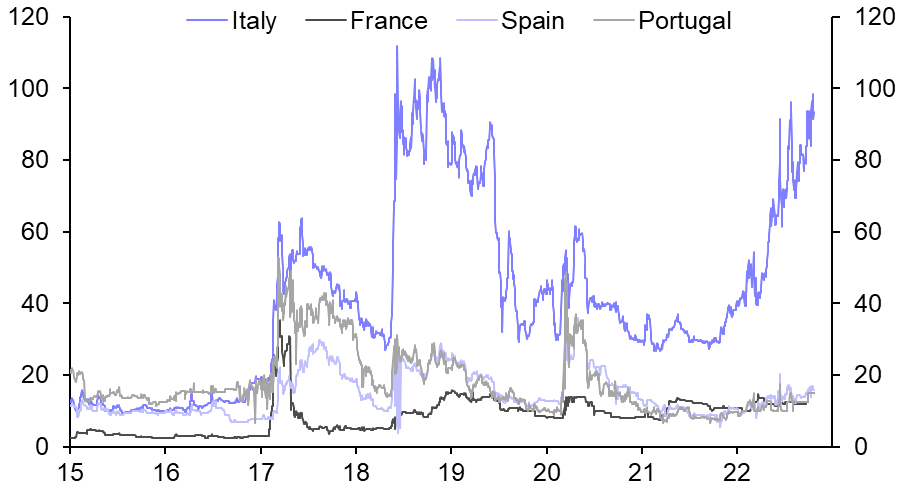
- Notwithstanding the ECB’s intervention, both the “Quanto spread” and “ISDA basis” (see here for detail) of CDS on Italian sovereign debt have continued to edge higher, although that may in part reflect poor liquidity conditions as much as an increase in perceived default risk (30 & 31).
|
Chart 26: 5-Year CDS Premia On Sovereigns (bp) |
Chart 27: 5-Year CDS Premia On Sovereigns (bp) |
|
|
|
|
Chart 28: 5-Year CDS Premia On Sovereigns (bp) |
Chart 29: Yield Spreads Of 10-Year Government Bonds Over 10-Year German Bunds (pp) |
|
|
|
|
Chart 30: “Quanto Spreads” Of 5-Year CDS On Sovereigns (bp) |
Chart 31: “ISDA Basis” Of 5-Year CDS On Sovereigns (bp) |
|
|
|
|
Sources: Refinitiv, Capital Economics |
Emerging Market Sovereigns
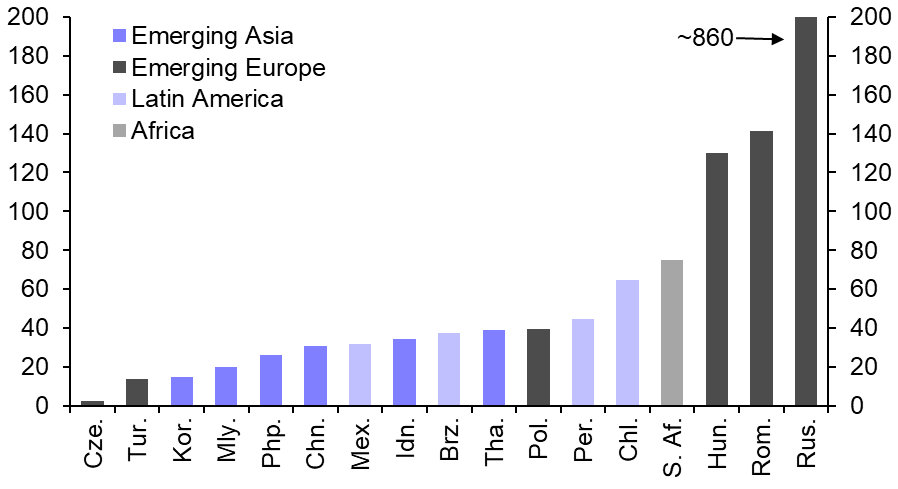
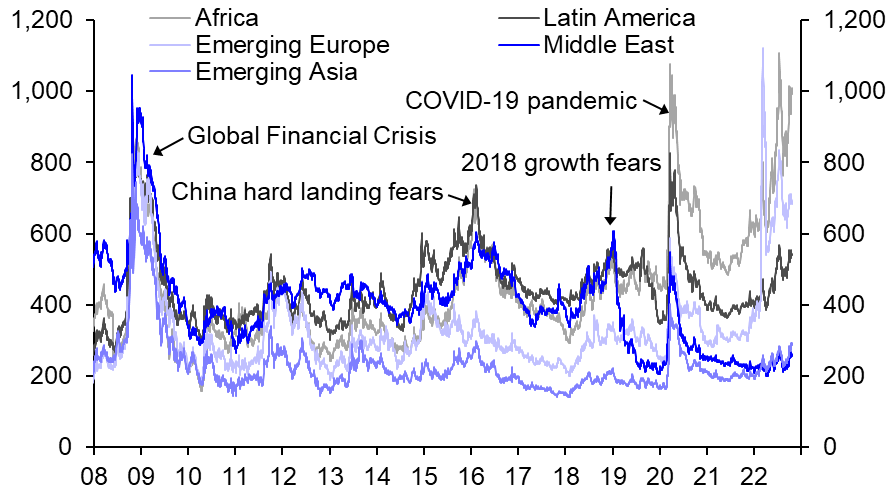
- The perceived risk of default of EM sovereign bonds has generally risen in recent months (32), amid spill-overs from the war in Ukraine, a strengthening dollar, rising interest rates globally and high commodity prices. Dollar bond spreads in Africa and Emerging Europe have now surpassed the peaks they reached during the GFC and the COVID-19 pandemic (33).
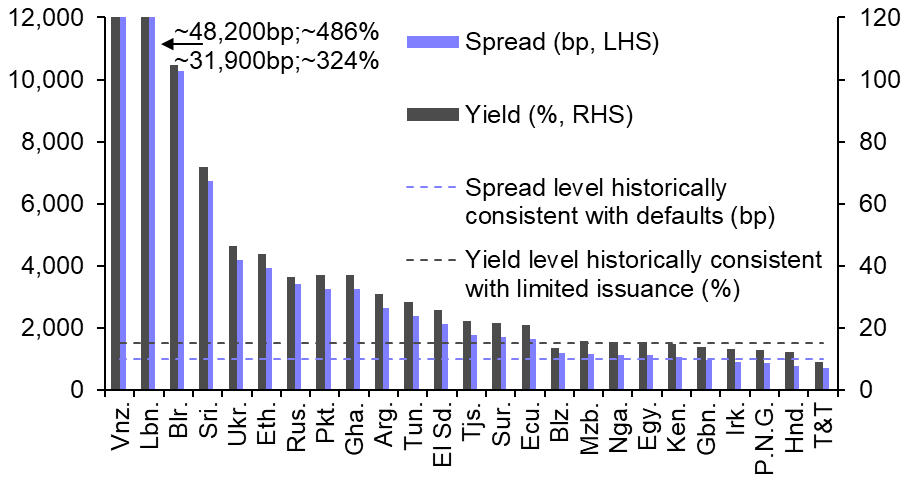
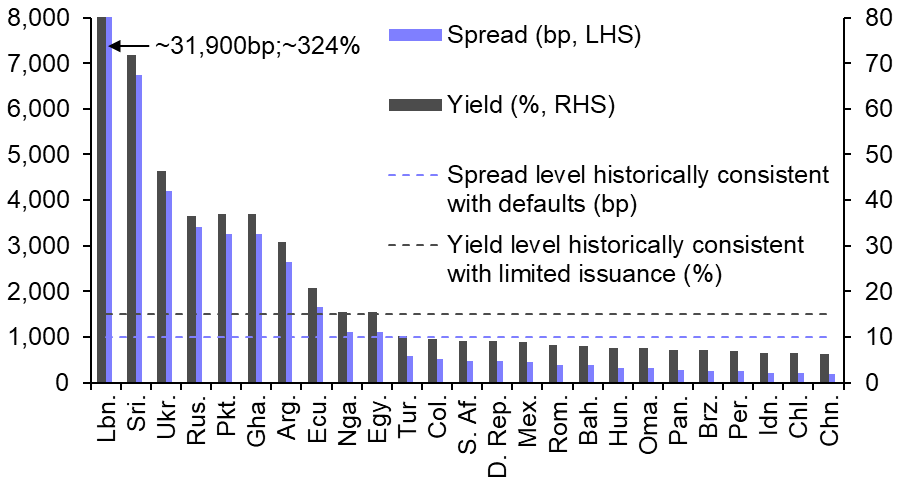
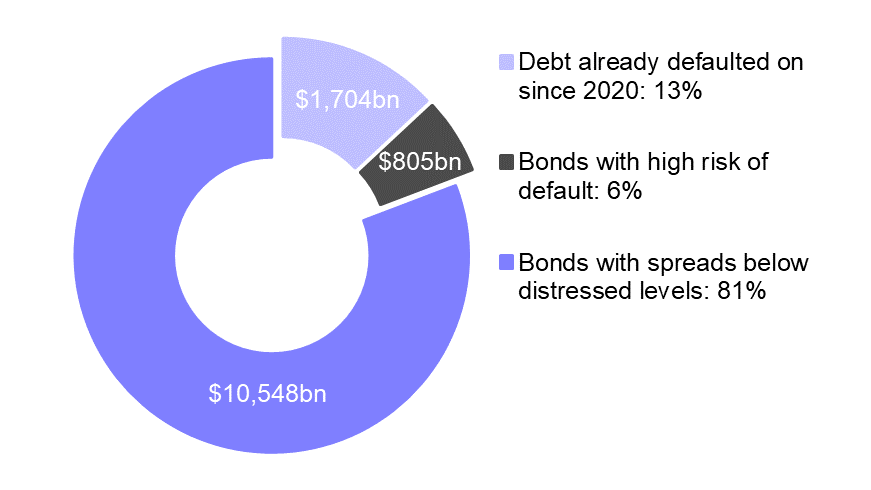
- 15 of the ~70 country constituents of the JPM EMBI Global index now have dollar bond yields above levels at which issuance has tended to drop sharply, and spreads at levels that have often preceded sovereign defaults in the past (34). Of these, six are among the 25 largest members of the index (35). Despite this, the face value of sovereign foreign bonds in countries at high risk of default is relatively small (and the current market value smaller still). So, in our view, the risk of major spill-over effects is limited (36).
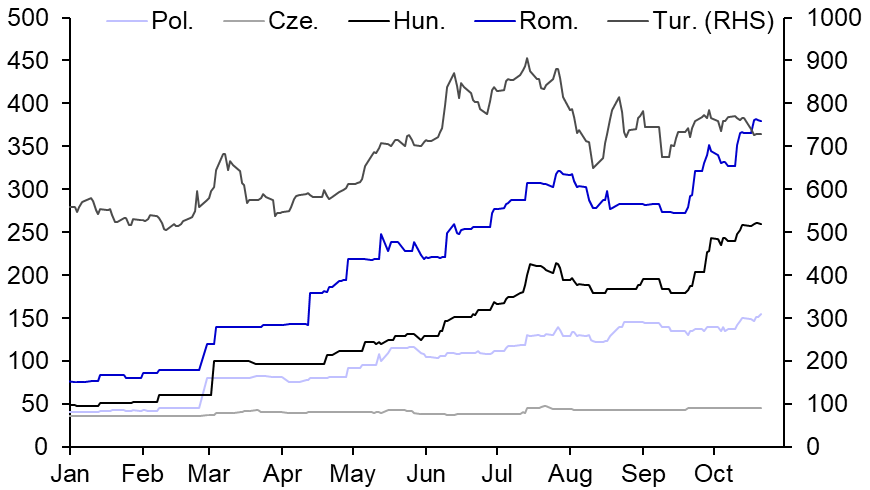
- Spreads remain at distressed levels in countries including Argentina, Ghana, Egypt, Sri Lanka and Tunisia. Elsewhere, CDS premia have risen in Emerging Europe since April, driven in large part by defaults in Russia and Ukraine. But they have also accelerated in the past month in Hungary and Romania (37), where the indirect effect of the war through energy prices has worsened pre-existing fiscal vulnerabilities.
|
Chart 32: Changes In 5-Year CDS Premia On Sovereigns (Since 20th May, bp) |
Chart 33: EMBI Global Government Bonds Spreads (bp) |
|
|
|
|
Chart 34: Highest 25 EMBI Country Index Government Bond Yields & Spreads (%/bp) |
Chart 35: Yields & Spreads Of Top 25 EMBI Constituent Country Indices (%/bp) |
|
|
|
|
Chart 36: JP Morgan EMBI Global Constituents (Face Value, $bn/%) |
Chart 37: 5-Year CDS Premia On Emerging Europe Sovereigns In 2022 (bp) |
|
|
|
|
Sources: Refinitiv, Capital Economics |
Jonas Goltermann, Senior Markets Economist, jonas.goltermann@capitaleconomics.com
Adam Hoyes, Markets Economist, adam.hoyes@capitaleconomics.com
Diana Iovanel, Markets Economist, diana.iovanel@capitaleconomics.com