Last week’s disappointing China economic releases were greeted by the usual calls for more stimulus to boost near-term growth. These are part of a long-standing tradition for when data undershoot expectations, reflecting the often short-term focus on China’s growth outlook.
But it’s the longer-term view of China’s economy where an interesting shift in debate has been occurring.
It has been captured in recent days by The Economist magazine, which devoted its cover story last week to discussion about whether China’s economy has peaked, basing its report in large part on our view that economic growth in China will slow to just 2% a year by the end of this decade.
As it happens, the coverage in The Economist coincided almost to the day with the five-year anniversary of a report by Mark Williams and Julian Evans-Pritchard from our China team which presented our case for China’s rate of trend growth slowing substantially over the long term.
When we published our report in 2018, the conventional view – sustained by forecasters inside and outside China – was that the Chinese economy would continue to grow rapidly, overtaking the US as the world’s biggest well before mid-century. Five years later, expectations for China’s economy have been significantly dialled back – but still not far enough, in our view.
Hitting the limits
Our 2018 view rested on two pillars. The first was that demographic pressures would cause the growth of China’s working age population to slow and then contract. The second was that output per worker (or productivity) would also increase at a much slower pace as China reached the limits of its growth model.
China’s demographic challenge is well documented, but the inherent strains in its growth model are less well understood. Rapid growth over the past three decades has come alongside an extremely high domestic savings rate. This peaked at 52% of GDP in 2008, and is currently around 45% (savings rates in emerging markets are more typically around 25% of GDP.)
One consequence of China’s high domestic savings is that household consumption accounts for a relatively small share of GDP. Accordingly, China has had to rely on other sources of demand to sustain growth – principally investment and exports. Investment currently accounts for around 43% of GDP while exports account for around 20%.
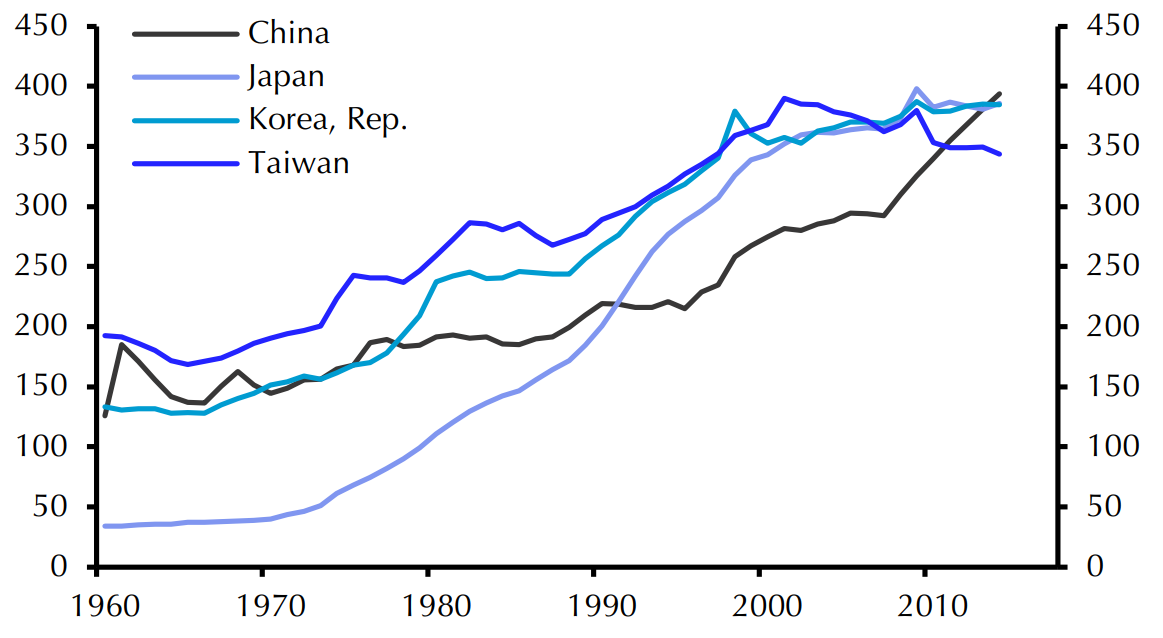
By 2018, strains in China’s growth model were starting to show. Its unprecedented reliance on investment as a source of demand meant that its capital stock was already large relative to the size of its economy. (Chart 1.) As a result, additional investment was being channelled into increasingly unproductive areas.
|
Chart 1: Capital Stock (% of GDP) |
|
|
| Sources: Penn World Table, Capital Economics |
At the same time, the sheer size of China’s economy meant that it was becoming difficult to sustain rapid growth in export demand – 15% of global exports now come from China and new markets are hard to find. Moreover, as we argued in the 2018 report, China’s dominance across the production of many goods was increasingly likely to elicit pushback from trading partners.
All of this meant that a new wave of reform was needed to avoid a medium-term growth slowdown, including reforms to direct a greater share of income to households, and thus make consumer spending a more important source of demand.
More fundamentally, we explained why, as China entered “middle income” territory, the experience of other highly successful Asian economies such as Korea and Taiwan showed how the market needed to play a much greater role in determining the allocation of capital and labour within the economy. Yet the drive by Xi Jinping to reassert the primacy of the Communist Party and centralise control over institutions pushed against market liberalisation. We argued that a combination of strains in China’s growth model and the shift in domestic politics away from necessary reforms would cause trend growth to grind down to just 2% a year by 2030.
Headwinds get headier
A lot has changed in the past five years, but in each of the areas we flagged in our initial report the constraints on growth have only become more pronounced.
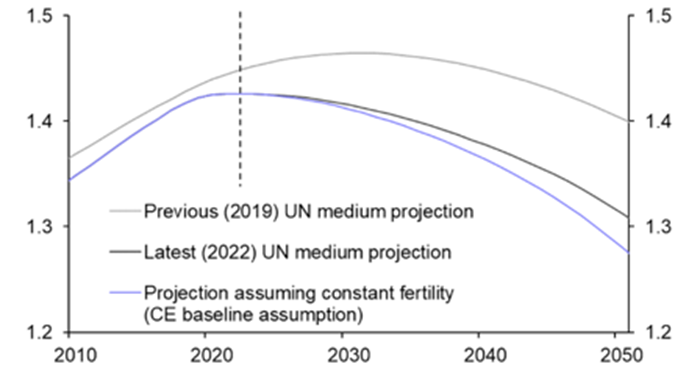
The demographic outlook, for example, has deteriorated faster than we had anticipated. Three years ago the UN thought that China’s population would peak in 2032. Now it thinks that the population peaked last year – a decade earlier than expected. (See Chart 2.)
|
Chart 2: China Population (billion people) |
|
|
| Sources: UN, Capital Economics |
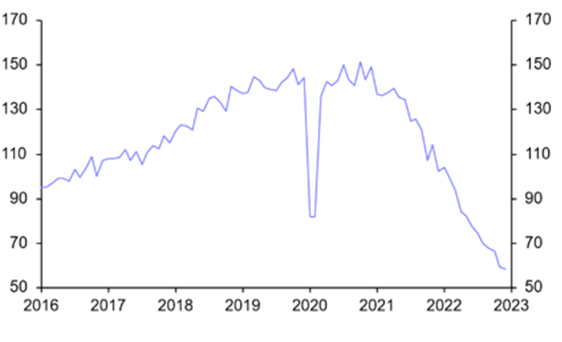
Likewise, while property investment continued to grow at a solid pace in 2018-19, the volume of new floor space peaked in 2021 and has since fallen sharply. (See Chart 3.) The crisis at China Evergrande became emblematic of broader excesses in property construction and development. A similar reckoning now looms in infrastructure and its funding via local government financing vehicles.
|
Chart 3: Floor Space Started (million sqm, seas. adj) |
|
|
| Sources: CEIC, Capital Economics |
Externally, the trade wars that started during the Trump administration have morphed into a broader fragmentation of the US-China relationship. This will touch everything from supply chains to cross-border financial flows.
Most importantly, the push towards greater centralisation and control has continued and manifested itself in several ways, not least a wide-ranging crackdown on the tech sector.
Although consensus expectations for China’s long-term growth have been slashed, they still look too optimistic. The IMF’s forecast for growth five years ahead (a reasonable proxy for its estimate of medium-term potential growth) is currently 3.5%. In contrast, we continue to expect medium-term growth of 2%.
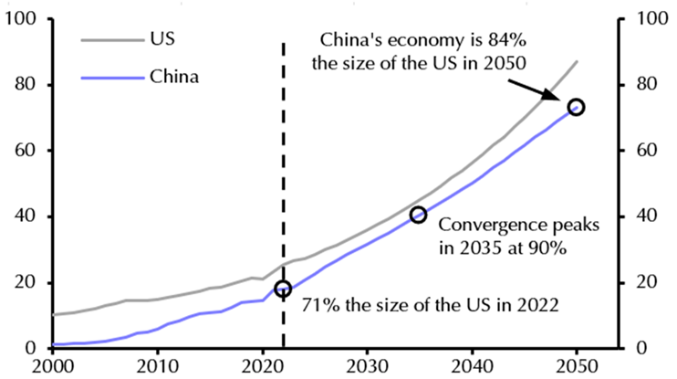
These differences may sound small, but they compound over a long period and have profound consequences for what the global economy looks like in the decades ahead. In particular, they challenge the widespread assumption that China will inevitably overtake the US as the world’s largest economy when measured at market exchange rates. In our forecasts, China’s convergence peaks around the end of this decade – and then drops back. (See Chart 4.)
|
Chart 4: CE Projections for US & China GDP (market exchange rate, $trn) |
|
|
|
Sources: Capital Economics |
In the wake of the April data, China’s authorities may respond to calls to do more to support the post-COVID recovery by rolling out measures to boost near-term growth – for example, we expect the People’s Bank of China to take more steps to reduce bank funding costs.
But, as we highlighted five years ago, it’s China’s longer-term growth outlook where the major economic and policy challenges lie.
You'll have a chance to discuss with our Chief Asia Economist Mark Williams how our views have evolved since we published the 2018 analysis at the online ‘Drop-In’ briefing we're holding on Thursday, 25th May (register for that session here).
In case you missed it:
- Mark Williams also discusses what has – and hasn’t – changed about our China outlook in this week’s podcast episode.
- A political row is breaking out in the UK over last year’s migration numbers, even before their official release this week. Deputy Chief UK Economist Ruth Gregory explains the economic impact of record inflows.
- Our US and Markets teams explored the risks around the latest US debt ceiling saga during a Drop-In last week. You can watch this recording if you missed the live chat.


