

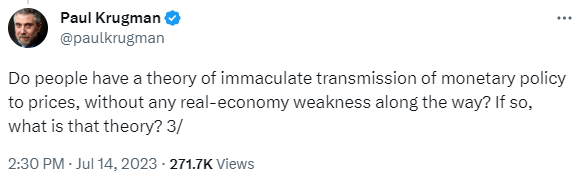
As Europe and North America decamp for the beaches, an intense debate has broken out among economists. It was framed neatly in a Tweet a few weeks ago by Nobel-Laureate Paul Krugman:
Put differently, how can we square the recent run of good news on inflation with the fact that there has so far been little evidence of slack developing in major advanced economies?
Disinflation takes hold
Signs of easing price pressures continue to gather. In the US, headline CPI inflation has fallen from a peak of 9.1% in June 2022 to 3.0% currently. Meanwhile, inflation on the Fed’s preferred PCE measure has fallen from a peak of 7.0% to 3.0% – and prices on this measure increased by just 0.2% m/m in June. Moreover, while declines in food and energy inflation have helped to pull down headline rates of inflation, there has been a much broader easing in price pressures. Core PCE inflation is now running at 4.1% y/y (down from a peak of 5.4%), and prices on this measure increased by 0.2% m/m in June having posted average monthly gains of around 0.4% over the previous six months (click here to join our US team’s post-July CPI report online briefing on Thursday).
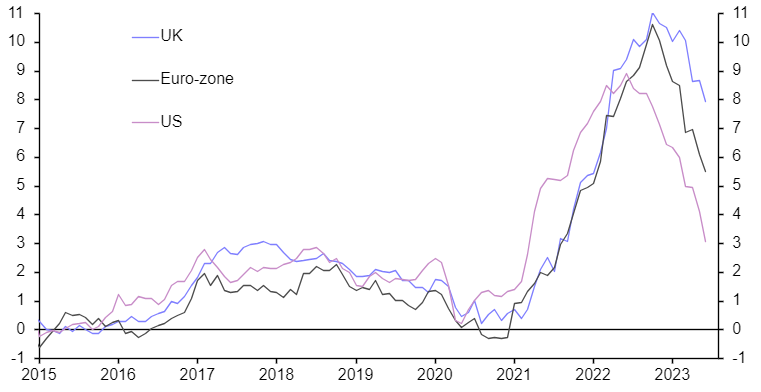
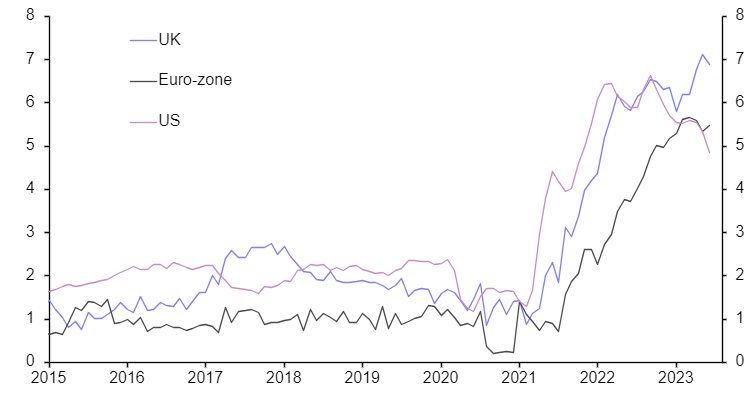
Nor is this just a US story. Headline inflation has been slower to fall in the euro-zone and, in particular, the UK, but it now appears to be on a downward path. (See Chart 1.)
|
Chart 1: Headline CPI (% y/y) |
|
|
|
Sources: Capital Economics |
And while core inflation in both places has been stickier, it is off the highs reached earlier this year. (See Chart 2.)
|
Chart 2: Core CPI (% y/y) |
|
|
|
Sources: Capital Economics |
In search of a new theory
The textbooks have a clear view of how this process is supposed to work: higher interest rates lead to weaker demand, which creates economic slack, which in turn leads to disinflation. Central banks have played their part, raising rates in the most aggressive tightening cycle since the last big war on inflation ended in the early 1980s. But as Krugman notes, the recent run of good news on inflation has come against a backdrop of extremely strong labour markets. The unemployment rate in the US has held steady at around 3.5% or so for the past year. Meanwhile, the unemployment rate in the euro-zone has fallen to its lowest rate in more than 25 years. There has been no increase in economic slack.
Why the disconnect? Part of the issue, as we’ve argued before, is that the approach to inflation that’s taught in Economics 101 has been fatally undermined by structural shifts in economies and labour markets over the past 20 years. Economists and central bankers need a new framework for thinking about inflation that is not rooted in the Phillips Curve, that now-discredited model showing a relationship between unemployment and inflation. But that’s a different story for another day.
As for the recent declines in inflation, part of the answer to the question posed by Krugman is that the pandemic and then the war in Ukraine caused one-off shocks to the level of prices of everything from food and energy to used cars that is now passing through. This has echoes of the period after the Second World War, when a combination of huge supply dislocation and the relaxation of price controls led to a short but sharp burst of inflation.
Over and above this, however, what’s missing from the debate, as Krugman notes, is an analytical framework for thinking about post-COVID moves in inflation and output at an economy-wide level, rather than for individual goods and services.
Return of the hockey stick
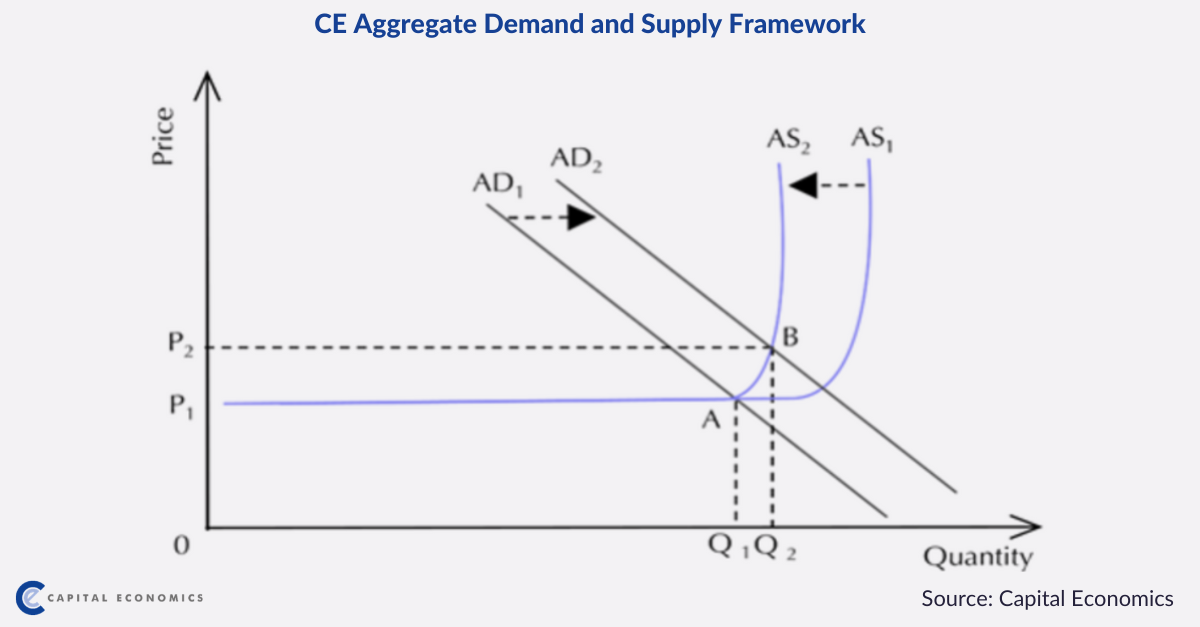
We set out our approach in a piece published last year. Twelve months on it tallies neatly with the recent US experience. In our framework, the aggregate demand curve slopes down and the aggregate supply curve is shaped like a hockey stick. When output is below potential, firms produce any amount of goods and services at the prevailing market price. But when output reaches potential, the price demanded by firms to supply more starts to increase sharply. (See Chart 3.)
|
Chart 3: Aggregate Demand and Supply Framework |
|
|
|
Sources: Capital Economics |
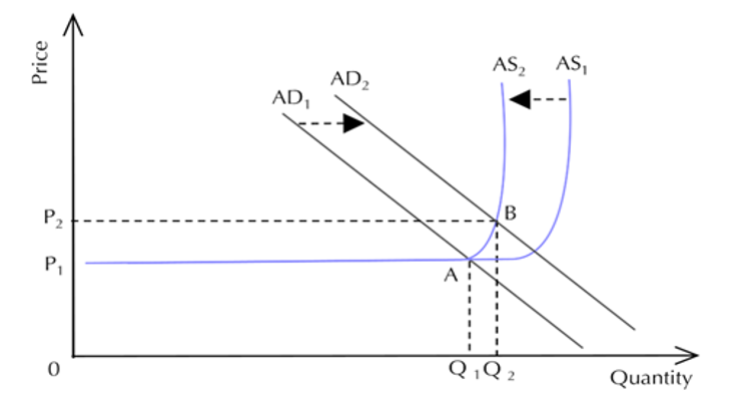
Accordingly, when output is below potential, shifts in demand create potentially large changes in output but relatively small changes in price. But when output reaches potential, shifts in demand generate small changes in output but potentially large changes in price – in either direction.
There have been two pronounced shifts within this framework over the past couple of years. First, the aggregate demand curve shifted out, from AD1 to AD2 in Chart 3 , due in part to the boost from pandemic-era fiscal stimulus and loose monetary policy. Second, the aggregate supply curve shifted in, from AS1 to AS2, as the pandemic and, to a lesser extent, the war in Ukraine caused dislocation in labour and product markets that reduced supply potential. As a result, economies moved from an equilibrium position of A, as seen in the chart, to an equilibrium position of B – output increased modestly but prices increased a lot.
Crucially, this shifted economies onto the vertical part of the aggregate supply curve – and to a place where small movements in demand create large moves in prices with little change in output. This may help to explain why inflation has fallen without the need for a large fall in output (or increase in economic slack). In addition, it’s likely that policymakers have also had a helping hand from a recovery in aggregate supply (i.e. from AS2 back to AS1) as pandemic-related supply restrictions have ended and labour market participation and employment has rebounded.
Labour markets hold the key
So much for the theory. The key question for central bankers and investors is whether the recent declines in inflation can be sustained without the eventual need for an increase in economic slack (or large falls in output). Much will hinge on what happens in labour markets.
The past few weeks have brought better news on this front too. In particular, the 1% q/q increase in ECI private wages and salaries in Q2, our preferred measure of US labour costs, pulled the annual rate of growth down from 5.1% y/y in Q1 to a two-year low of 4.6%.
However, this is still too high to be consistent with a 2% inflation target in an economy where trend productivity growth is still below 2%. What’s more, wage growth in the euro-zone and the UK has been much slower to fall and remains far too high for either the ECB’s or the Bank of England’s liking. The concern is that unless wage growth cools, so-called “second round” effects will lead to a renewed rise in inflation further down the line.
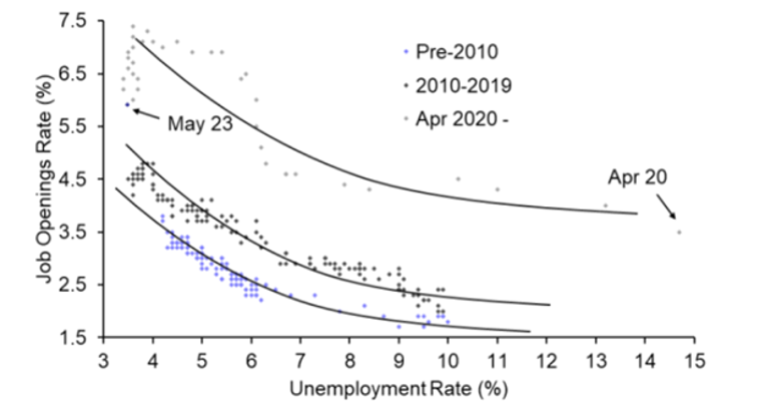
The good news is that this could also be achieved without injecting a lot of slack into the labour market. As we’ve noted before, the pandemic caused the Beveridge Curve, which plots the relationship between unemployment and job openings, to shift out. Shifts in the sectoral composition of employment, skill requirements and the geographical location of employment all made it harder for firms to find the right workers to fill vacancies. As a result, firms had to pay more to fill these positions. But as pandemic-era frictions have eased, so the Beveridge Curve is showing signs of shifting back down – meaning that the pressure to increase pay to fill vacancies has started to moderate. (See Chart 4.)
|
Chart 4: US Beveridge Curve |
|
|
|
Sources: Capital Economics |
Stepping back, a path to a soft-landing – or “immaculate disinflation”, as this process has been dubbed – has always been possible in theory. The more important question is whether this is likely in practice. In the US, our long-held view has been that, for the reasons set out above, inflation would fall without the need for a recession – and to the extent that a recession was likely it would be a mild one. Our conviction in our recession call has perhaps fallen a bit in recent months, but our conviction in our inflation call has strengthened.
The bigger challenges will come in economies where supply-side improvements have been slower to materialise. Chief among these is the UK. One consequence is that while it’s possible to envisage the Fed cutting interest rates at some point in the first half of 2024, the Bank of England (and probably the ECB) will be later to the easing party.
What you may have missed
Our UK team created a core inflation proxy series in order to look at inflationary episodes from the 1970s and 1980s and determine the conditions necessary to bring core inflation back under control.
Senior Markets Economist Thomas Mathews explains why the boost to “risky” assets from signs of economic resilience may have run its course.
Egypt’s surprise 100bps rate hike last week was a much-needed step towards orthodoxy but severe near-term challenges remain. For the long-term view, see James Swanston’s recent analysis outlining the country’s enormous economic potential.