While the outcome of the midterms remains unclear, far more important for the economy was October’s softer-than-expected core CPI data, which support our view that the Fed won’t need to raise interest rates as far as markets had feared.
Softer core CPI marks start of disinflationary trend
The October CPI report showed the widespread disinflationary pressure evident in the surveys and other private-sector measures finally feeding through. Admittedly, the softer 0.3% m/m rise in core prices partly reflected the unusual measurement of CPI health insurance prices, which swung from a 2.1% m/m rise in September to a 4.0% drop last month. Additional steep declines are now all but guaranteed for the next 12 months. But encouragingly, there were tentative signs that the relentless acceleration in monthly shelter price gains may have peaked.
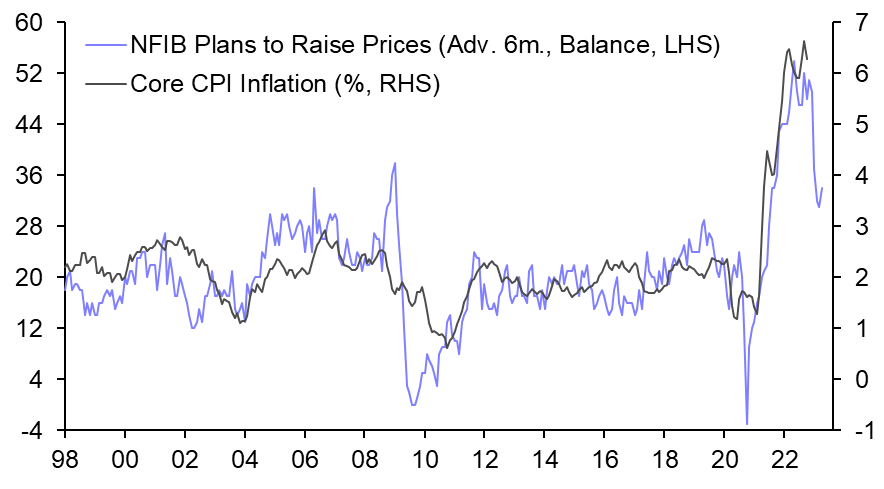
The clearest evidence of disinflation was the 0.4% m/m fall in core goods prices, which we expect has much further to run – as easing shortages and the stronger dollar feed through. That echoes the message from the October NFIB survey, released earlier this week, which showed that markedly fewer firms are planning price rises. Although the survey also showed a rebound in the share of firms planning wage increases, suggesting labour market conditions remain tight, the fading of price pressures in the goods sector alone is set to drive core inflation much lower from here. (See Chart 1.)
|
Chart 1: NFIB Small Business Price & Comp. Plans |
|
|
|
Source: Refinitiv |
While there is still plenty more data to come over the next four weeks, the October report makes it more likely that the Fed will slow the pace of tightening to 50bp at the next FOMC meeting in mid-December. And if we’re right that this marks the start of a longer disinflationary trend – as we set out in this Focus published last week – it won’t be long before the Fed stops its tightening cycle entirely. We continue to expect rates to peak at 4.50%-4.75% early next year, with a sharp fall in inflation and a mild recession convincing the Fed to begin cutting rates again before the end of 2023.
Midterms suggest fiscal policy to take a back seat
We still don’t know the full results from Tuesday’s elections. The Republicans are seemingly set to win control of the House by only a few seats and, while the Senate may not be decided until another run-off election in Georgia in a month’s time, the Democrats are now tipped to win in Arizona and Nevada which would give them the 50 seats needed to retain control. Either way, the results are being spun as something of a victory for President Joe Biden given that, despite rampant inflation, the Democrats look to have delivered the strongest midterm showing for an incumbent President’s party in decades.
The likely loss of the House means Biden won’t be able to push through any further big changes in fiscal policy and raises the risk of a debt ceiling crisis next summer. But the more interesting story from the midterms still looks to be the weakness of Donald Trump’s endorsements and the strength of Florida Governor Ron DeSantis, who is now neck-and-neck with Trump in the race to secure the Republican nomination in 2024. Although Trump was reportedly set to announce his campaign next Tuesday, it remains to be seen whether that will happen after all.
The week ahead
October retail sales will include a price-related boost to gasoline sales and, as supply shortages have eased, a rebound in motor vehicle sales. Otherwise, we expect a muted gain in control group sales. Industrial production probably edged up last month but, with the surveys weakening, a factory sector downturn is coming soon
Data Previews
Retail Sales (Oct.) 08.30 Wed. 16th Nov.
|
Forecasts |
Previous |
Median |
Capital Economics |
|
Retail Sales |
0.0% |
+0.9% |
+1.3% |
|
Core Retail Sales (Less Autos) |
+0.1% |
+0.5% |
+0.7% |
Boosted by motor vehicles and gasoline
We expect a 1.3% m/m rise in retail sales, driven by a price-related resurgence in gasoline sales and a rebound in motor vehicle sales linked to easing supply shortages.
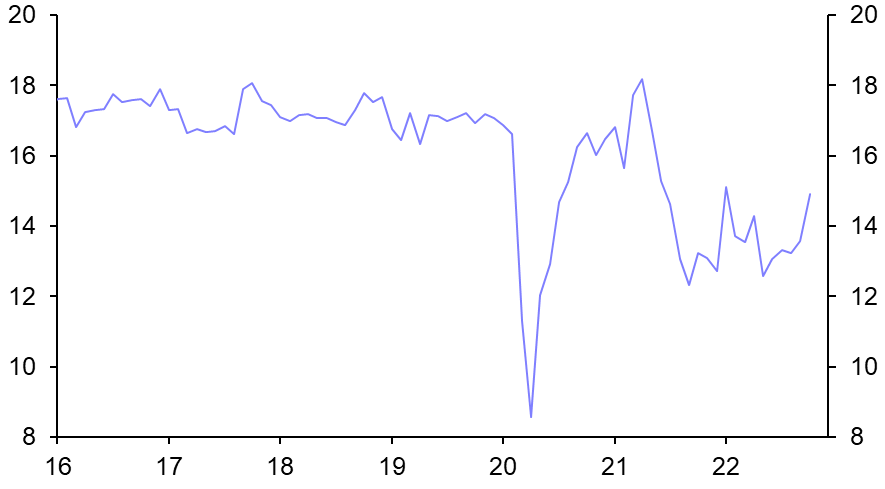
The 4% m/m rise in gasoline prices points to a similar-sized increase in the nominal value of gasoline station sales. According to manufacturers, light vehicle unit sales rebounded by close to 10% m/m last month, to a nine-month high of 14.9 million annualised, as easing supply shortages boosted sales. (See Chart 2.)
We have pencilled in a 0.3% m/m increase in control group retail sales. Sales have held up surprisingly well in recent months despite the surge in interest rates. However, we suspect the rebound in gasoline prices held back spending on other goods. In the aftermath of Hurricane Ian, spending may also have been muted in the Southwest.
|
Chart 2: Light Vehicle Sales (Mn, Annualised) |
|
|
|
Sources: Refinitiv, Capital Economics |
Industrial Production (Oct.) 09.15 Wed. 16th Nov.
|
Forecasts |
Previous |
Median |
Capital Economics |
|
Industrial Production |
+0.4% |
+0.2% |
+0.2% |
|
Manufacturing Output |
+0.4% |
+0.3% |
+0.2% |
Manufacturing slowdown
We estimate that industrial production increased by a muted 0.2% m/m in October.
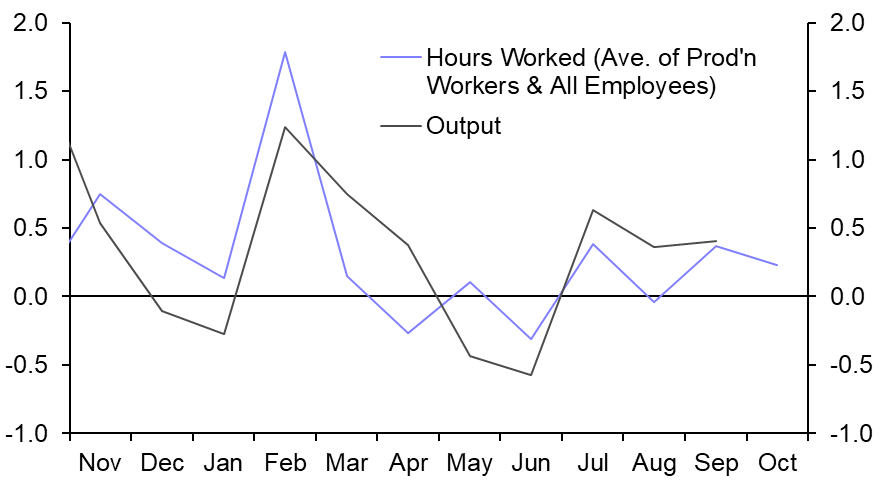
With manufacturing employment rising by a healthy 32,000 last month but average hours worked unchanged, we are pencilling in a more modest 0.2% m/m increase in manufacturing output for October. (See Chart 3.)
With the survey evidence weakening amid a deteriorating global backdrop, manufacturing output may well begin to fall over the coming months.
Otherwise, we anticipate a modest 0.5% m/m gain in mining output, with Hurricane Ian doing little lasting damage to offshore production in the Gulf of Mexico.
Finally, we estimate that utilities output was broadly unchanged, with unseasonably warm weather on the West Coast offset by unseasonably cool weather in the Southeast
|
Chart 3: Manufacturing Output & Hours Worked |
|
|
|
Source: Refinitiv |
NAHB Index/Housing Starts (Nov./Oct.) 10.00/08.30 Wed. 16th/Thu. 17th Nov
|
Forecasts |
Previous |
Consensus |
Capital Economics |
|
NAHB Index |
38 |
36 |
35 |
|
Housing Starts (000s, Annualised) |
1,439 |
1,420 |
1,300 |
Rising mortgage rates hit starts
We estimate that single-family starts fell to 800,000 annualised in October, with multifamily starts dropping to 500,000. That would leave total starts at 1.30m annualised.
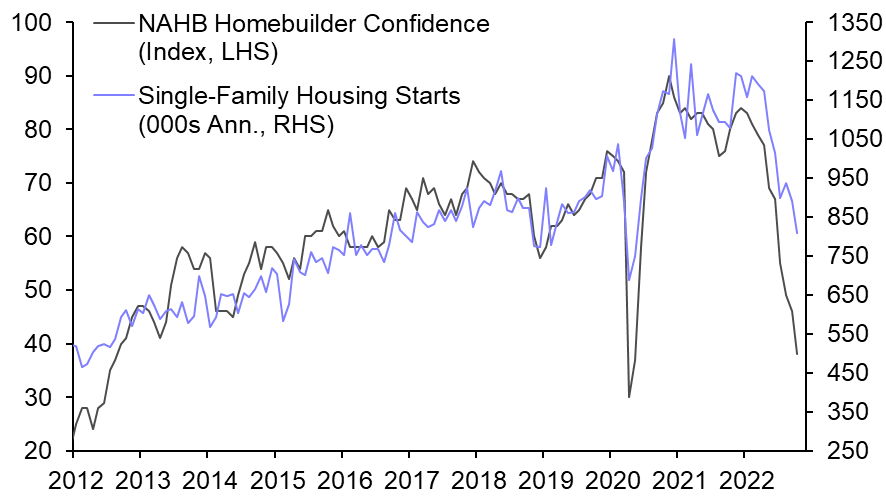
The rise in mortgage interest rates to more than 7% in October triggered another step-down in mortgage applications. This points to weak new home sales in the coming months, which will keep homebuilder confidence depressed. Based on the historical relationship, that would be consistent with further declines in single-family starts over the remainder of the year. (See Chart 4.) We expect them to decline to 650,000 annualised by end-2022.
Starts are likely to trend lower in the multifamily sector too. We expect surging interest rates to send the economy into a mild recession next year causing employment growth to stall. And tenants will increasingly come up against affordability constraints which we think will prompt a small fall in rents next year. In response to the weak rent outlook, we expect multifamily starts will decrease in the coming months, ending the year at slightly more than 400,000 annualised.
|
Chart 4: NAHB Homebuilder Confidence & SF Starts |
|
|
|
Source: Refinitiv |
Economic Diary & Forecasts
|
Upcoming Events and Data Releases |
|||||
|
Release/Indicator/Event |
Time EST (GMT-5) |
Previous* |
Median* |
CE Forecasts* |
|
|
Mon 14th |
No Significant Data Released |
- |
- |
- |
- |
|
Tue 15th |
Producer Prices (Oct) |
08.30 |
+0.4%(+8.5%) |
+0.5%(+8.3%) |
+0.5%(+8.3%) |
|
Core Producer Prices (Oct) |
08.30 |
+0.3%(+7.2%) |
+0.4%(+7.2%) |
+0.4%(+7.2%) |
|
|
Empire State Manufacturing Index (Nov) |
08.30 |
-9.1 |
- |
-10.0 |
|
|
Wed 16th |
Retail Sales (Oct) |
08.30 |
0.0% |
+0.9% |
+1.3% |
|
Core Retail Sales (Oct) |
08.30 |
+0.1% |
+0.5% |
+0.7% |
|
|
Control Group Retails Sales (Oct) |
08.30 |
+0.4% |
+0.2% |
+0.3% |
|
|
Import Prices (Oct) |
08.30 |
-1.2%(+6.0%) |
-0.5% |
- |
|
|
Industrial Production (Oct) |
09.15 |
+0.4% |
+0.2% |
+0.2% |
|
|
Capacity Utilisation (Oct) |
09.15 |
80.3% |
80.4% |
80.3 |
|
|
Manufacturing Output (Oct) |
09.15 |
+0.4% |
+0.3% |
+0.2% |
|
|
Business Inventories (Sep) |
10.00 |
+0.8% |
+0.5% |
+0.5% |
|
|
NAHB Housing Market Index (Nov) |
10.00 |
38 |
36 |
35 |
|
|
Net Foreign Purchases of US Securities (Sep) |
16.00 |
+$275.6bn |
- |
- |
|
|
Thu 17th |
Initial Jobless Claims (w/e 12th Nov) |
08.30 |
225,000 |
- |
|
|
Housing Starts (Oct) |
08.30 |
1,439,000 |
1,420,000 |
1,300,000 |
|
|
Philly Fed Manufacturing Index (Nov) |
08.30 |
-8.7 |
-6.0 |
-10.0 |
|
|
Fri 18th |
Existing Home Sales (Oct) |
10.00 |
4,710,000 |
4,370,000 |
4,350,000 |
|
Index of Leading Indicators (Oct) |
10.00 |
-0.4% |
-0.4% |
-0.4% |
|
|
Selected future data releases and events |
|||||
|
23rd Nov |
Durable Goods (Oct) |
08.30 |
|||
|
14th Dec |
Fed Policy Announcement |
14.00 |
|||
|
*m/m(y/y) unless otherwise stated Sources: Bloomberg, Capital Economics |
|||||
|
Main Economic & Market Forecasts |
|||||||||
|
%q/q ann. (%y/y) unless stated |
Q3 2022 |
Q4 2022 |
Q1 2023 |
Q2 2023 |
Q3 2023 |
Q4 2023 |
2022 |
2023 |
2024 |
|
GDP |
+2.6 |
+0.7 |
-0.5 |
-0.4 |
-0.3 |
+0.6 |
(+1.9) |
(0.2) |
(+1.2) |
|
CPI Inflation1 |
(+8.3) |
(+7.3) |
(+5.4) |
(+3.4) |
(+2.2) |
(+1.7) |
(+8.0) |
(+3.2) |
(+1.6) |
|
Core CPI Inflation1 |
(+6.3) |
(+6.1) |
(+5.4) |
(+4.5) |
(+3.4) |
(+2.7) |
(+6.2) |
(+4.0) |
(+2.2) |
|
Unemployment Rate,%1 |
3.6 |
3.7 |
4.0 |
4.4 |
4.8 |
4.9 |
3.7 |
4.5 |
4.8 |
|
Fed Funds Rate,%2 |
3.00-3.25 |
4.25-4.50 |
4.50-4.75 |
4.50-4.75 |
4.25-4.50 |
4.00-4.25 |
4.25-4.50 |
4.00-4.25 |
2.75-3.00 |
|
10y Treasury Yield,%2 |
3.80 |
4.00 |
3.75 |
3.60 |
3.40 |
3.25 |
4.00 |
3.25 |
3.00 |
|
S&P 5002 |
3586 |
3800 |
3400 |
3200 |
3500 |
3800 |
3600 |
3800 |
4200 |
|
$/€2 |
0.98 |
0.95 |
0.95 |
0.95 |
0.95 |
0.95 |
0.95 |
0.95 |
1.05 |
|
¥/$2 |
145 |
145 |
145 |
145 |
140 |
135 |
145 |
135 |
125 |
|
Sources: Refinitiv, Capital Economics. 1Period Average 2End Period |
|||||||||
Andrew Hunter, Senior US Economist, +44 (0)20 7808 4071, andrew.hunter@capitaleconomics.com