- China’s dominance in the supply of some key materials needed for the green transition means that tracking imports of certain goods from the country can offer a timely, albeit imperfect, window into the rollout of renewable technology elsewhere – particularly Europe.
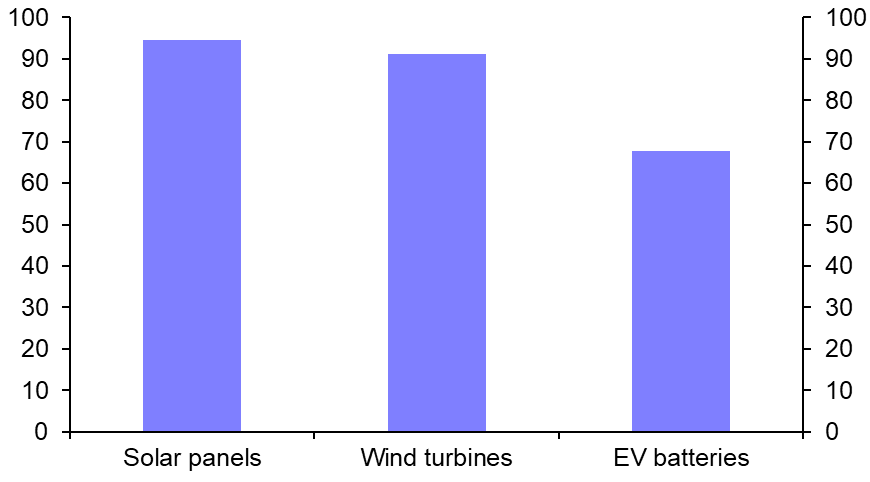
- A recent Spotlight report highlighted China’s key position in the supply of green technology, and this is evident in its export of solar panels, wind-powered generators and electric vehicle batteries to the US-bloc. The reliance on China is most pronounced for Europe. Indeed, in 2021, more than 90% of imports of solar panels and wind-powered generators into the EU came from China (See Chart 1.)
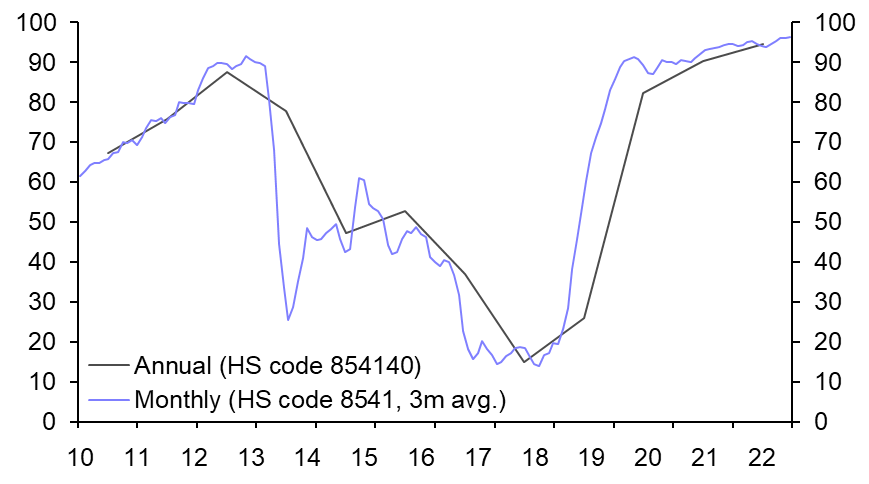
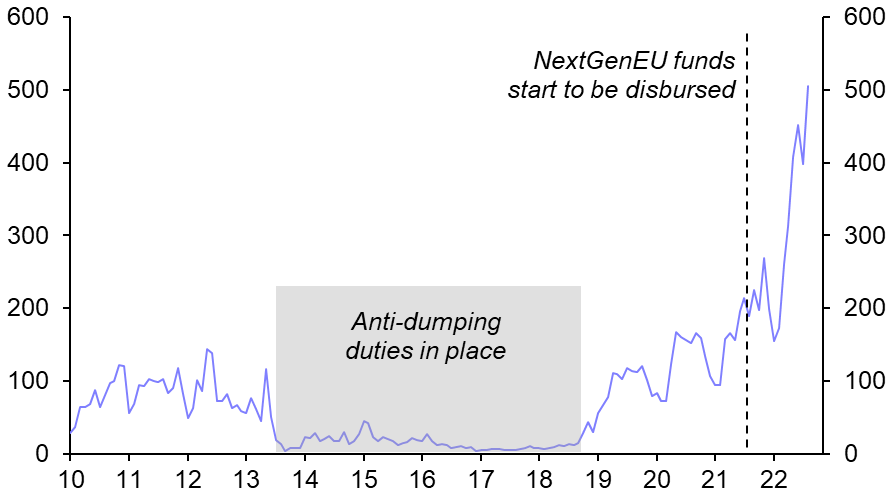
- The UN Comtrade dataset gives a timely view of trends in some of these key goods categories. (See Chart 2.) We will monitor the dataset closely and report on it periodically. Admittedly, the fact that Chinese battery firms own and operate factories overseas means that the trade data may not fully capture China’s role in the supply of EV batteries. Nonetheless, the monthly trade data are useful for assessing key turning points – notably the surge in EU imports of solar panels from China since early 2022. (See Chart 3.)
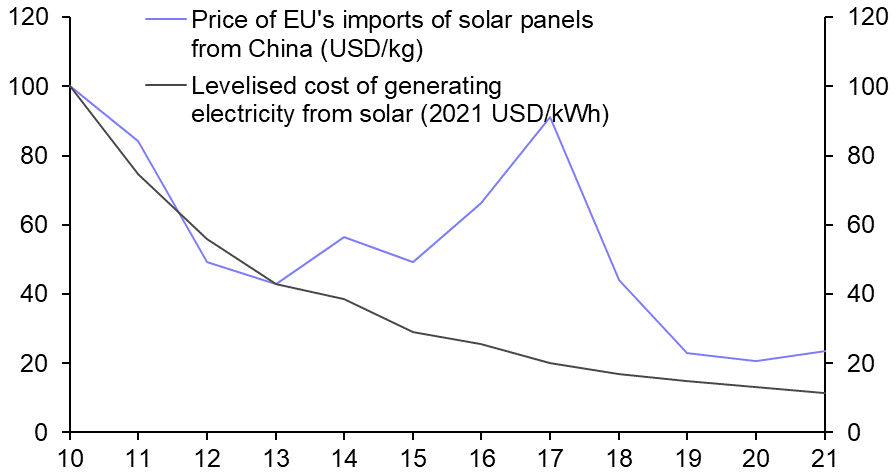
- One thing that stands out at this stage is the potential for government actions to disrupt trade flows. For example, while the price of EU solar panel imports from China largely fell in line with the cost of generating electricity from solar panels between 2010 and 2021, the two series diverged between 2013 and 2018 as the imposition of “anti-dumping” duties by the EU caused import volumes to collapse. (See Charts 3 & 4.)
- While worries about the impact of global fracturing tend to focus on the risk of China withholding the supply of green technology to the US-led bloc, this example shows how government actions in the west could also delay and push up the cost of the green transition. The EU’s Forced Labour Directive is a key thing to watch in that regard: given concerns about the use of forced labour in polysilicon mining in China, the proposed law, which could be in place in 2025, might disrupt the import of Chinese solar panels again.
|
Chart 1: EU Imports from China (% of Total, 2021) |
Chart 2: Share of EU’s Solar Cell Imports from China (%) |
|
|
|
|
Chart 3: Imports of Solar Panels and LEDs |
Chart 4: Price of Imported Solar Panels & “Levelised” Cost of Generating Electricity Using Solar (2010 = 100) |
|
|
|
|
Sources: UN Comtrade, IRENA, Capital Economics |
Kaine Wright, Economist, kaine.wright@capitaleconomics.com
David Oxley, Head of Climate Economics, david.oxley@capitaleconomics.com