The outsized attention paid to Taiwan’s presidential election this past weekend is in part a reflection of the breakdown in relations between the US and China and the 21st century’s big geopolitical question of which of these countries will dominate the global economic system.
That question fuels the long-running debate over which economy is larger. The disagreement is not over how much is produced by each economy. Rather, it is about how this economic output, which is priced in local currency, should then be converted into a common currency for the purposes of cross-country comparison.
This isn’t just a parlour game among economists: accurately measure an economy’s size and you get a sense of its ability to project power and its standing in an increasingly fractured global system.
GDP can be converted into a common currency using market exchange rates or purchasing power parity (PPP) exchange rates.
Market exchange rates, as the name suggests, convert each unit of (local currency) GDP into US dollars at the prevailing spot exchange rate. This is easy to calculate but subject to the usual vagaries of currency markets, meaning that GDP reported in US dollars can be volatile even if GDP in domestic currency is relatively stable.
In contrast, PPP exchange rates use the rate at which the currency of one country would have to be converted into that of another country in order to buy the same amount of goods and services in each country. This approach has two potential benefits. PPP exchange rates tend to be more stable (although more on this later) and also take account of differences in domestic price levels, and therefore the domestic purchasing power of one unit of income (or GDP). For this reason, emerging economies, where the domestic price level tends to be lower, particularly in non-tradable sectors, tend to get a boost in PPP rankings relative to those based on market exchange rates.
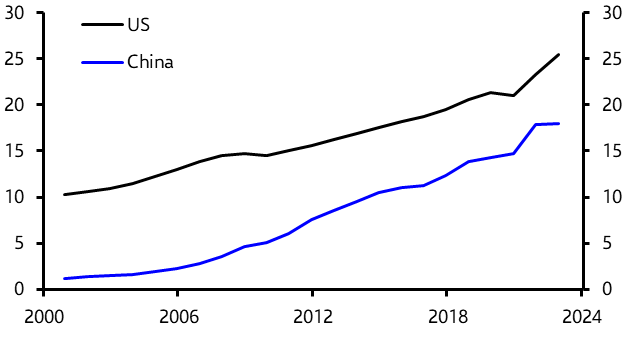
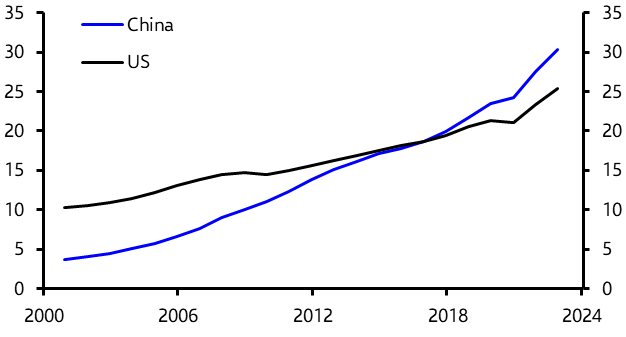
This matters for the debate over which of the US or China has the larger economy because, measured at market exchange rates, US GDP is still around 40% larger than that of China. (See Chart 1.) But when measured at PPP exchange rates, China’s economy overtook that of the US in 2016 and is now about 20% bigger. (See Chart 2.)
|
Chart 1: GDP at market exchange rates ($tn) |
|
|
|
Source: Capital Economics |
|
Chart 2: GDP at PPP exchange rates ($tn) |
|
|
|
Source: Capital Economics |
Size matters
At its heart, this is a debate about which country has the greatest economic weight. One argument for using PPP exchange rates is that they adjust for domestic purchasing power and therefore allow comparisons to be made based on the amount of goods and services that the income generated by output can buy. This matters for both economic and military heft – after all, armies are funded in domestic currency.
But the ability to project economic power overseas also matters, meaning that global purchasing power is important. Imperfect though they are, this is what market exchange rates measure and why they are a better measure of economies. An emerging economy can produce lots of cheap, non-traded services like haircuts, but that does not increase its global economic clout. Likewise, what matters for multinational companies is the US dollar (or euro) value of sales in each country. This is reflected in GDP calculated at market exchange rates, not PPP.
Finally, while it’s fair to say that market exchange rates are volatile, PPP exchange rates require an accurate estimate of the domestic price level, which is extremely difficult. For example, the IMF revised down its estimate of China’s GDP at PPP exchange rates by 40% in 2005 following the incorporation of better price data. PPP exchange rates may be less volatile day-to-day, but that doesn’t mean they are more accurate.
Friends matter more
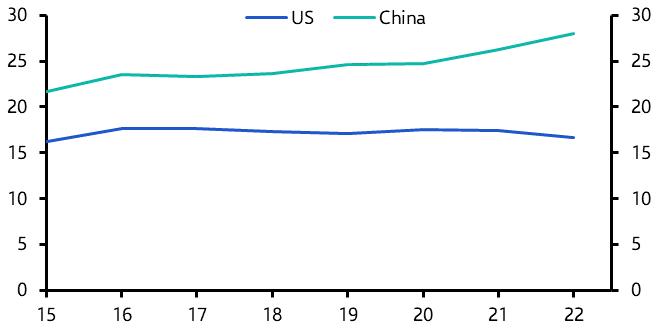
Those arguing that China has greater global economic heft than the US are on safer ground when pointing to the relative size of manufacturing sectors. China currently accounts for around 28% of global manufacturing compared to 17% for the US. (See Chart 3.) China’s manufacturing sector is globally dominant, and its infrastructure provides Beijing with huge scope to increase the output of military equipment (if military competition is what is motivating these comparisons).
|
Chart 3: Share of Global Manufacturing (%) |
|
|
|
Sources: Capital Economics |
But context is key and allies are important. Our work on global fracturing shows how most major economies – including those in Europe, but also Mexico, India, Korea and Japan – align with the US. In contrast, the bloc of economies aligned with China is dominated by China itself but otherwise comprises a selection of smaller economies that are mainly commodity producers. As the world splinters into these US- and China-aligned blocs, the best way to think about global economic heft is through the scale and composition of their respective groupings. On this basis, the US- aligned bloc accounts for a larger share of global manufacturing than the China bloc. (See Chart 4.)
|
Chart 4: Share of Global Manufacturing accounted for by US and China blocs (%) |
|
|
|
Source: Capital Economics |
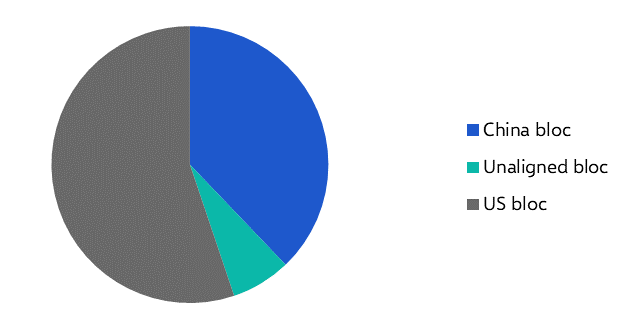
Furthermore, when measured at PPP exchange rates, the US aligned bloc of economies is significantly larger than the China bloc, accounting for 55% of global GDP versus 35%.
Not for the first time, economists may have missed the point.
In case you missed it:
Our Commodities team assessed the response of energy markets to US-UK attacks on Houthi military targets.
Our US team previews the Iowa caucuses, which start today. See also Chief US Economist Paul Ashworth’s assessment of the macro risks around the 2024 race.
Ashley Webb looked at what rising household loan defaults could mean for the UK economic outlook, while Stephen Brown took a closer look at the Q4 rise in Chapter 11 business bankruptcies in the US.