The COP28 jamboree in Dubai will produce a long list of climate promises from governments and corporate leaders, but these will be of little practical help to market participants attempting to track progress on the green transition in a systematic way. For that, a data-driven approach is needed in order to separate the rhetoric from the reality. Our Climate Reporting tools are designed exactly for this purpose – and they produce some important insights that are worth keeping in mind as the reports from Dubai continue to filter through.
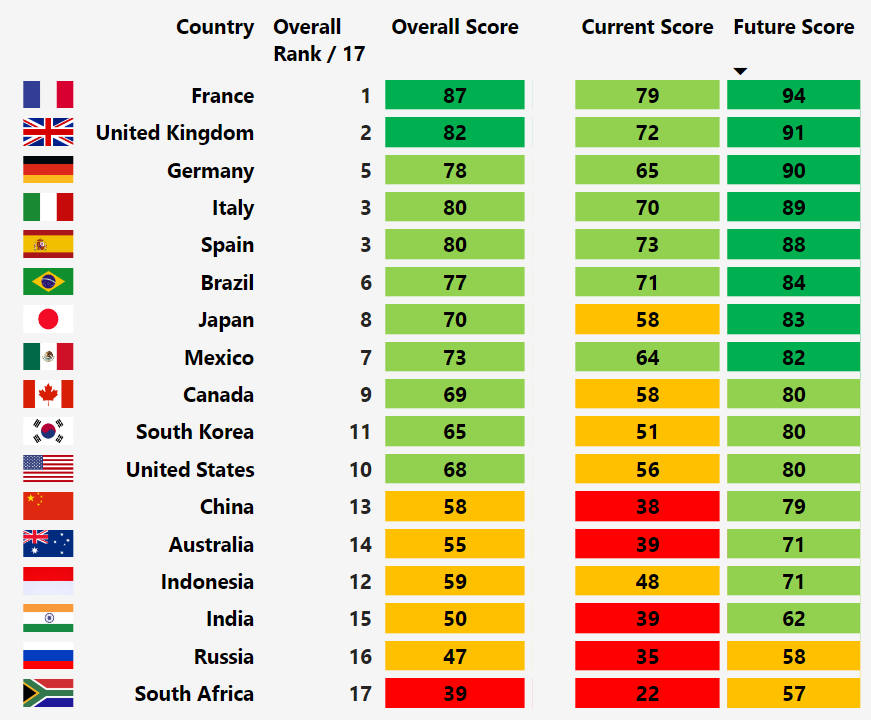
China often finds itself at the sharp end of criticism when it comes to green policies and it is easy to find alarming statistics on its climate footprint. Having overtaken the US as the world’s biggest polluter in 2004, China now accounts for more than one quarter of global greenhouse gas emissions. And whereas per capita emissions of carbon dioxide (CO2) peaked in the 1970s/1980s in the US, EU, and UK, those in China are continuing to increase. All of this explains why China ranks 15th out of 17 countries in the ‘current score’ index of our Climate Transition Scores. (These rank countries according to a range of variables including low-carbon electricity generation, coal consumption, and greenhouse gas emissions. All of the scores and underlying metrics are downloadable using our proprietary tool.)
|
Chart 1: Capital Economics Climate Transition Scores (Ranked By Current Score) |
|
|
|
Sources: Capital Economics |
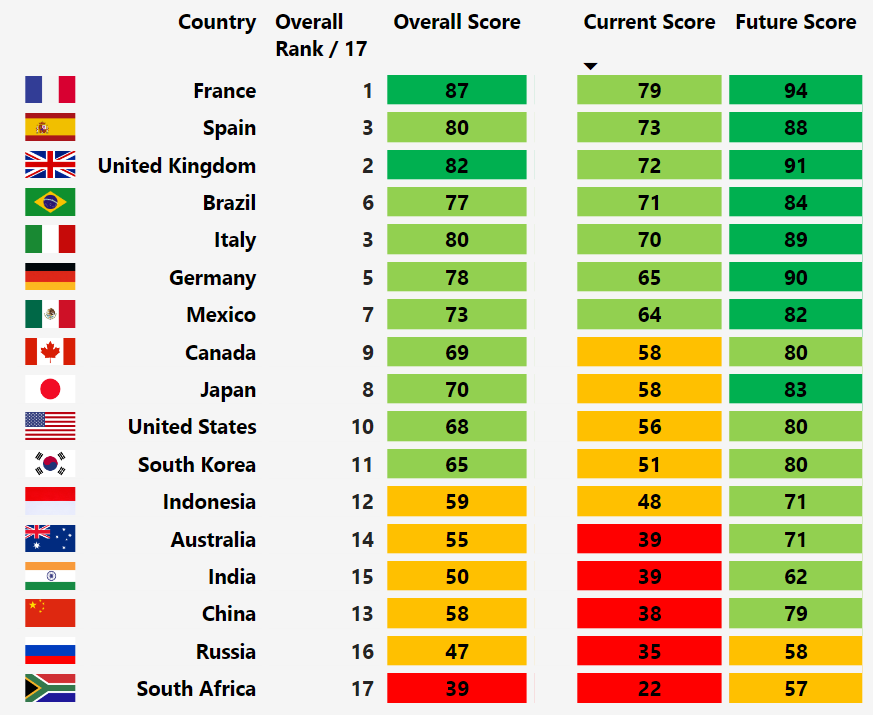
But this only tells part of the story. China’s strategic focus on dominating emerging manufacturing sectors like batteries and solar power has yielded significant competitive advantages in their production as well as strong influence over the supply of the raw materials that underpin them. This in turn has helped to supercharge China’s electric vehicle sector in particular. Meanwhile, Beijing is funneling billions of dollars into renewable energy.
All of this means that, in addition to thinking about China’s climate footprint today, we also need to consider how it is likely to change over the coming years. For this reason we have developed a ‘future’ score in our climate transition metrics – and on this measure China leaps to 12th on our rankings, just behind Canada and the US. (See Chart 2.) Indeed, China has the biggest improvement between our ‘current’ and ‘future’ scores of any major economy.
|
Chart 2: Capital Economics Climate Transition Scores (Ranked By Future Score) |
|
|
|
Sources: Capital Economics |
Our Climate tools also suggest that there is a more nuanced picture around the green transition playing out in the US. The conventional view is that there is a broad consensus behind the need to tackle climate change in coastal states (which lean Democrat) but that progress is being held back by central and southern States (which lean Republican).
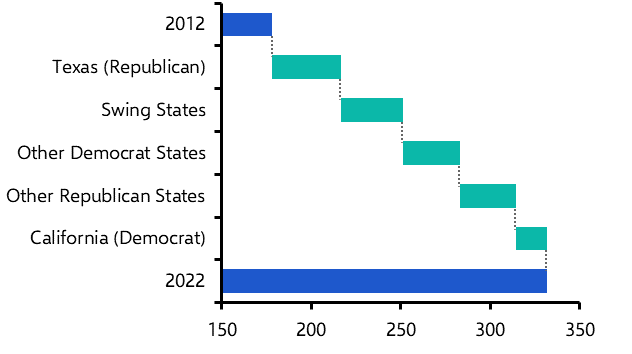
However, our Regional Climate Databank reveals that, in several areas, red states have been at the vanguard of the climate transition in the US. Republican-leaning states have installed 35% more renewable capacity than Democrat-leaning ones since 2012. (See Chart 3.) Indeed, Texas alone has been responsible for one-quarter of the increase in America’s renewable capacity over this period. (Our tools also include regional climate data for China and the UK.)
|
Chart 3: US Renewable Electricity Generating Capacity (GW) |
|
|
|
Sources: US EIA, Capital Economics |
This is the combined result of generous subsidies under the Inflation Reduction Act, a collapse in the price of renewable sources, notably solar, following technical advancements, and a corporate culture that has meant firms have been quick to take advantage of both government incentives and new technology. This illustrates how government, business and technology will each play a crucial (and mutually self-reinforcing) role in the green transition.
Amid the wealth of data insight within our Climate Reporting Tools, three broad points stand out among many.
First, Europe will continue to lead the climate transition, but the US will close the gap over the coming years (and Germany, which is currently lagging, will catch up to its European peers).
Second, both China and India score poorly on our “Current” Climate Transition Index, but China is likely to make more progress greening its economy. This suggests that India will face increasing scrutiny on the climate front.
Finally, there is a wide range in performance between EMs on current transition scores. This partly reflects geography (Brazil has a natural advantage in hydro power) but also economic structure (mining sectors are heavy emitters and put Russia and South Africa at a natural disadvantage). Because these are structural issues, these divergences will persist. Accordingly, the current divergence within EMs is likely to last well into the future.
Perhaps the key point, however, is that when it comes to the green transition, investors need to focus on the data rather than the rhetoric.
In case you missed it:
- In last week’s note, I set out the key themes that will shape the global economic and market outlook in 2024. In a subsequent piece, Chief Global Economist, Jennifer McKeown, has outlined the principal risks to our view and explained how these would alter the macro and market outlook.
We will be online to answer all your questions about the 2024 outlook on Tuesday 5th December. Register here.