The US government’s reported plans to raise barriers on Chinese imports of green tech – including a potentially sharp rise in electric vehicle tariffs – could trigger a further ratcheting up of bilateral tensions around the issue of industrial overcapacity.
However, even as Chinese overcapacity has become yet another contentious issue in Sino-US relations, from a balance of payments perspective, structural changes in the US economy mean it poses less of an immediate threat than when trade imbalances were building in the mid-2000s.
As we’ve noted before, the real issue is not so much Chinese overcapacity as Chinese underconsumption. From a narrow economic perspective, there is nothing wrong with China producing large amounts of goods and exporting them at low prices to the rest of the world. The real issue is that China’s imports, and therefore its demand for other countries' goods and services, are too low. The result has been a sharp rebound in China’s current account surplus. On some measures, it is now back to the record share of global GDP reached in 2006. (See Chart 1.)
|
Chart 1: China Current Account Balance (% of World ex-China GDP) |
|
|
|
Sources: State Administration of Foreign Exchange, Capital Economics |
The problem with trade imbalances
China’s surplus is a problem for the rest of the world because it represents a drain on demand at a global level. What’s more, because the balance of payments must balance, it also necessitates that one or a number of countries must run an offsetting deficit. This requires that they consume more than they produce, which in turn means that they must borrow from abroad to finance their consumption, thereby accumulating external liabilities. In order to do this on a sustained basis they must retain the confidence of capricious foreign investors. This adds an additional element of vulnerability to the global economic and financial system.
Given that China is now the world’s second largest economy, the only other economy able to absorb its huge surplus is the US. This was also the case in the mid-2000s when China ran a similarly large surplus. Back then the US current account deficit breached 6% of GDP. (See Chart 2.) This was a clear indication that the US was living beyond its means, the consequences of which were felt in the Global Financial Crisis. But that was then. The US current account deficit is now running at just over 3% of GDP – large, but not dangerously so.
| Chart 2: US Current Account Deficit (% of GDP) |
 |
| Source: Refinitiv |
America’s changed economy
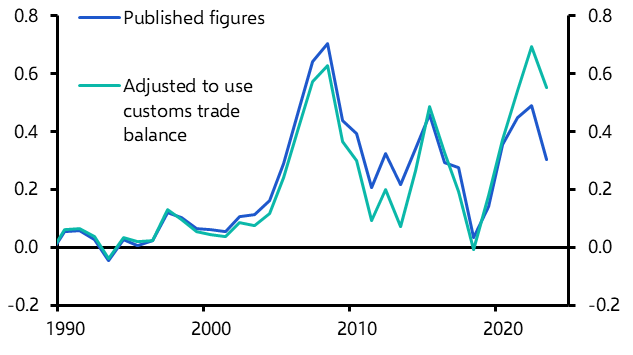
The narrowing of the US deficit reflects profound, but underappreciated, changes in the structure of the US economy over the past decade. In his assessment of the strong dollar’s threat to the economy, Chief US Economist Paul Ashworth notes that the US non-energy deficit is now close to levels last seen in the mid 2000s. (See Chart 3.)
| Chart 3: US Trade Balance (% of GDP) |
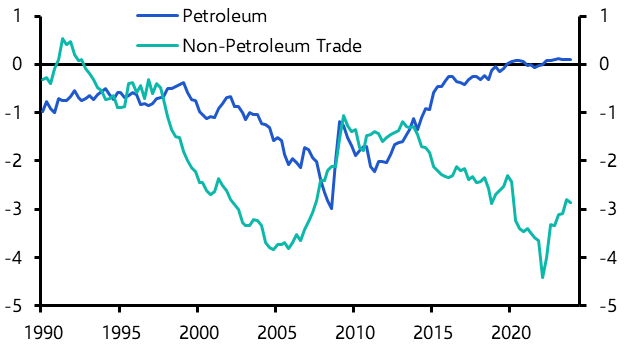 |
| Source: Refinitiv |
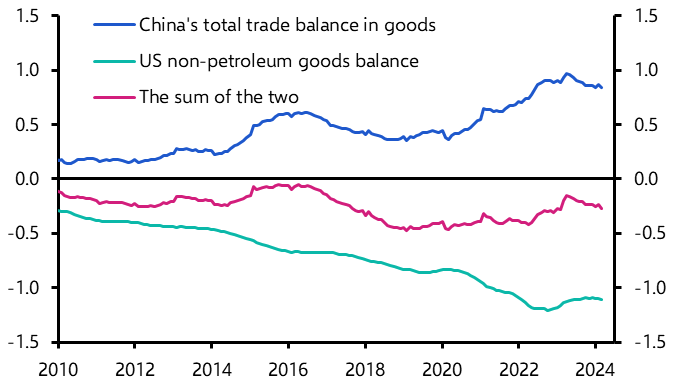
Viewed from the other side, China’s exports are principally manufactured goods. And if we look at China’s goods surplus, it is broadly offset by the US non-petroleum goods deficit. (See Chart 4.) In other words, it is generally correct to say that the US is absorbing China’s large external surplus.
|
Chart 4: China and US non-Petroleum Goods Balance ($ trn, 12m sum) |
|
|
|
Sources: Refinitiv, Capital Economics |
However, the US energy balance has shifted from a deficit of around 2% of GDP in the mid-2000s to a small surplus today. (See Chart 3 again.) This reflects the development of US shale oil and natural gas, and the country's transformation into an energy superpower. The improvement in the US’s energy balance has limited the deterioration in its overall current account position. Its counterpart has been smaller surpluses in other oil-producing countries and in Russia. (See Chart 5.)
|
Chart 5: Current Account Balances (US$ Bn) |
|
|
|
Sources: IMF, Capital Economics |
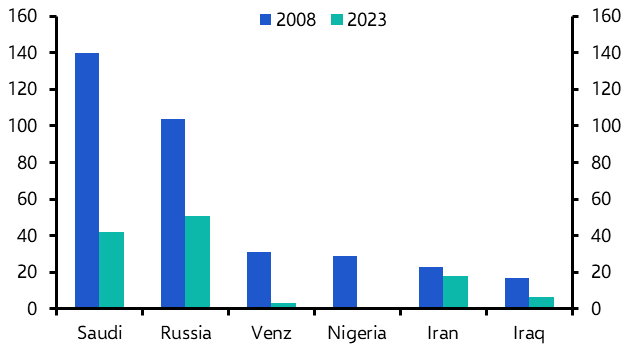
The result is that while China’s surplus has rebounded, there has been a significant shift in trade balances elsewhere in the world. Surpluses in the oil producers have fallen as the US has squeezed their market share. And this has contained a widening of the overall US deficit that otherwise would have occurred as the US absorbed China’s rising goods surplus.
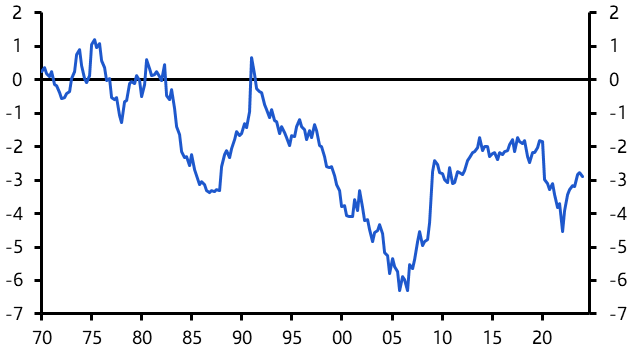
Admittedly, the legacy of running a significant current account deficit for the past 25 years means the US has built up a large stock of external liabilities. (See Chart 6.) This is now running at close to 70% of GDP and requires servicing in the same way that any liability does. This could in time pose a threat to the dollar, since a weaker dollar would raise the value of US foreign assets (which are non-dollar denominated) relative to US foreign liabilities (which are in dollars), thereby reducing net foreign liabilities as a share of GDP.
| Chart 6: US Net Foreign Assets (% of GDP) |
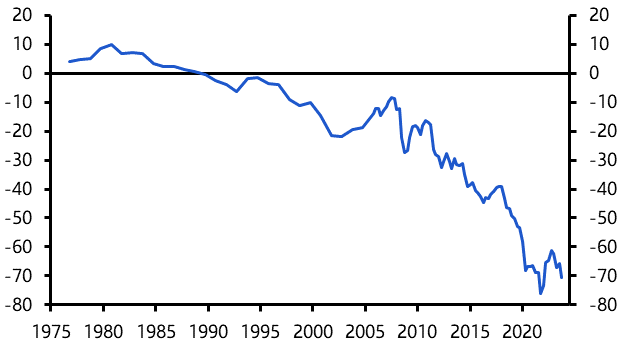 |
| Source: Refinitiv |
But the fact that the US still manages to run a small primary income surplus on its balance of payments, because it earns more on its external assets than it has to pay on its liabilities, limits the immediate threat to the dollar. And the bigger picture remains that the shift in the US energy balance has reduced its external vulnerabilities and increased the structural resilience of its economy.
Another prop to US exceptionalism
Of course, the fact that the US is running a more sustainable balance of payments position than during the highly imbalanced first years of this century is unlikely to detract from the intensifying fight over signs of Chinese productive dominance in key emerging industries. This isn't a fight over the specific size of current account deficits; US policy is geared towards trying to maintain economic and technological leadership in a new era of geo-political rivalry with China.
At the same time, however, the development of the US energy sector – and its related impact on the country’s balance of payments – hasn’t received enough attention as one of several factors that have underpinned American economic outperformance since the pandemic.
We’ll go into much greater detail about the potential for the US economy and its financial markets to continue outperforming in this year’s annual Spotlight project. An in-depth report and associated data dashboards will explain why the US economy and its markets have outperformed and whether it can retain its position as the global leader. I’ll have more to say about the work in future notes, but drop me an email if you are interested in learning more and register for accompanying events, starting with our panel discussion in London on 11 June (details here.)
In case you missed it:
Our China team explained why state efforts to rein in overcapacity in battery production are unlikely to be successful.
Ahead of another haul of US price data, we reiterated the importance of the PCE measure of inflation over the CPI report,
It’s unusual that the yen and Japanese stocks move in tandem, as they have in recent weeks. Here’s why this relationship won’t last.