Our tracker models suggest the odds of a recession are rising although, on balance, we still expect a period of weak growth rather than an outright contraction. If we are wrong and a recession drives the unemployment rate up more significantly, then that would only increase our conviction that both headline and core inflation will fall more rapidly than the Fed currently believes, paving the way for rate cuts before the end of next year.
Recession odds rising
This week we published our latest Recession Watch (publication here and CEI data dashboard here), with our composite tracker models showing marked increases in the probabilities of the economy being in recession in both six and 12 months’ time. (See Chart 1.) For the longer-horizon 12m ahead model, the odds have rarely exceeded the current 20% without a recession eventually following. But there are exceptions – such as the second half of the 1990s. Furthermore, that far ahead the model is more dependent on the yield curve and broader financial conditions rather than hard economic data, making it fallible. Despite their historical accuracy in the US, we’re still sceptical of the value of yield curve inversions as a recession indicator. Their performance in other countries has been a lot more mixed and we’ve never been convinced by arguments that inversions somehow cause recessions.
|
Chart 1: CE Recession Tracker Models – Probability of being in recession in 6/12m months’ time |
|
|
|
Source: CE |
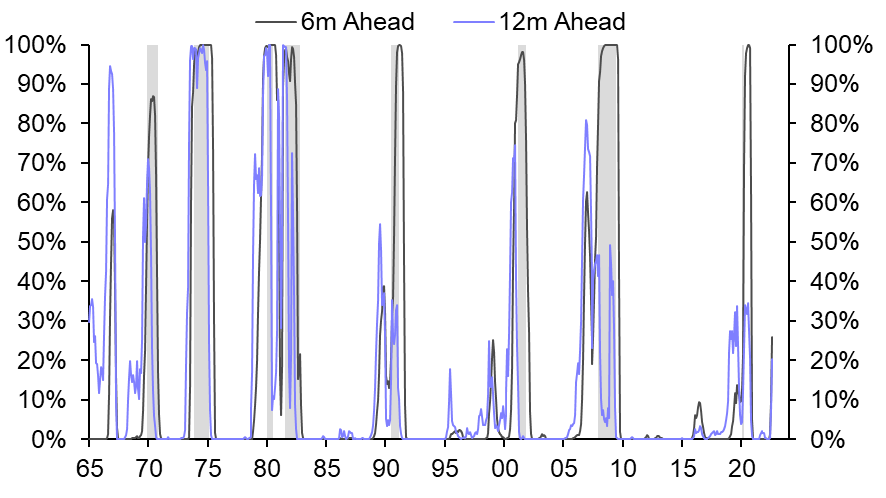
At the six-month horizon, our composite model relies more on economic data – including ISM manufacturing new orders, building permits and jobless claims. That model puts the odds of a recession at an even higher 26%, but it is also a lot more reliable, with the odds in the lead up to past recessions regularly peaking at close to 100%. The upshot is that, despite the higher current probability, we wouldn’t worry unduly that the economy will be in recession in six months’ time.
Latest employment and activity data mixed
This week’s activity data releases painted something of a mixed picture. The 315,000 gain in non-farm payroll employment in August and even stronger 442,000 increase in household employment suggest that the labour market is in good health. In addition, the massive 786,000 increase in the labour force, which pushed the unemployment rate back up to 3.7%, suggests a soft landing can be achieved, with wage growth easing without the need for an outright contraction in employment.
Meanwhile, the ISM manufacturing new orders index rebounded back above the 50 mark – with the headline index still at a relatively safe 52.8 last month. Admittedly, construction spending contracted by 0.4% m/m in July, but that was a bit better than we were braced for, with the decline in residential spending partially offset by a rally in both private and public non-residential spending. All things considered, our estimate for third-quarter GDP growth is still at a healthy 3% annualised. We expect the economy to avoid a recession over the next 12 months, but it could be a near-run thing – we don’t expect GDP growth to climb back to the economy’s 2% potential pace on a sustained basis until 2024.
The week ahead
Next week we expect to learn that the trade deficit narrowed markedly in July, as imports dropped back sharply. In strictly arithmetic terms, falling imports are good for GDP growth but, more generally, would be more of a worry if the decline reflects weaker domestic demand.
Data Previews
ISM Services Index (Aug.) 10.00 Tue. 6th Sep.
|
Forecasts |
Previous |
Median |
Capital Economics |
|
Headline index |
56.7 |
55.2 |
55.5 |
Services activity still holding up
We expect the ISM services index to have fallen back slightly in August, but it should still have remained consistent with a rebound in third-quarter GDP.
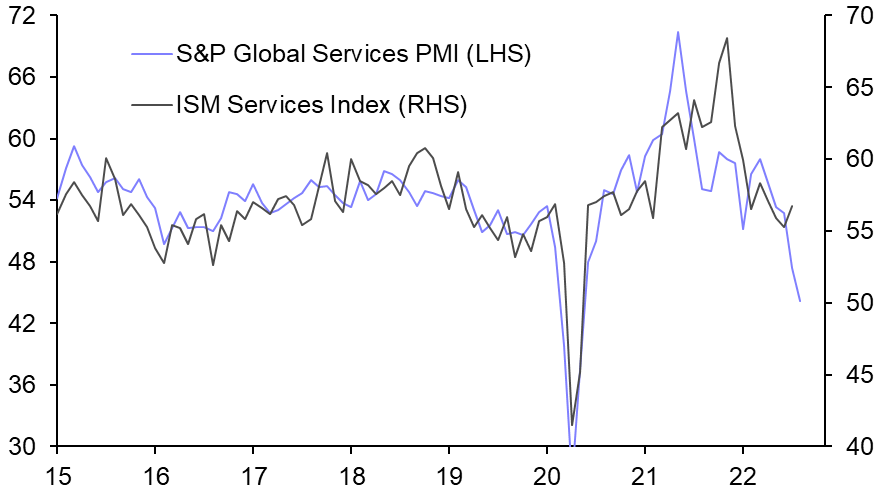
The plunge in the alternative services PMI published by S&P Global over the past couple of months has set alarm bells ringing over the health of the economy. (See Chart 2.) But the ISM index held up far better in July and the latest regional Fed services surveys suggest that resilience broadly continued last month. Our model points to a slight drop back in the ISM services survey, but only to around 55.5, from 56.7. That would leave it still much stronger than the PMI and consistent with GDP growth of around 2% annualised.
The August release is also likely to show further declines in the supplier deliveries and prices paid indices, consistent with inflationary pressures in the services sector easing.
|
Chart 2: S&P Global Services PMI & ISM Services |
|
|
|
Sources: Refinitiv, S&P Global |
International Trade (Jul.) 08.30 Wed. 7th Sep.
|
Forecasts |
Previous |
Median |
Capital Economics |
|
International trade balance |
-$79.6bn |
-$70.1bn |
-$70.0bn |
Deficit shrinking rapidly
The apparent further sharp decline in the trade deficit in July puts net trade on course to provide another big boost to GDP growth in the third quarter.
The advance report showed the goods deficit falling to $89.1bn in July, from $98.6bn, as exports were little changed but imports fell by 3.5% m/m. The latter was broad based and appears to reflect the continued unwinding of the earlier surge in inventory accumulation. But the rebound in autos trade in both directions is another sign that shortages in the sector may be easing. Assuming a further slight rise in the services surplus, we calculate that the overall trade deficit fell to a nine-month low of $70.0bn, from $79.6bn.
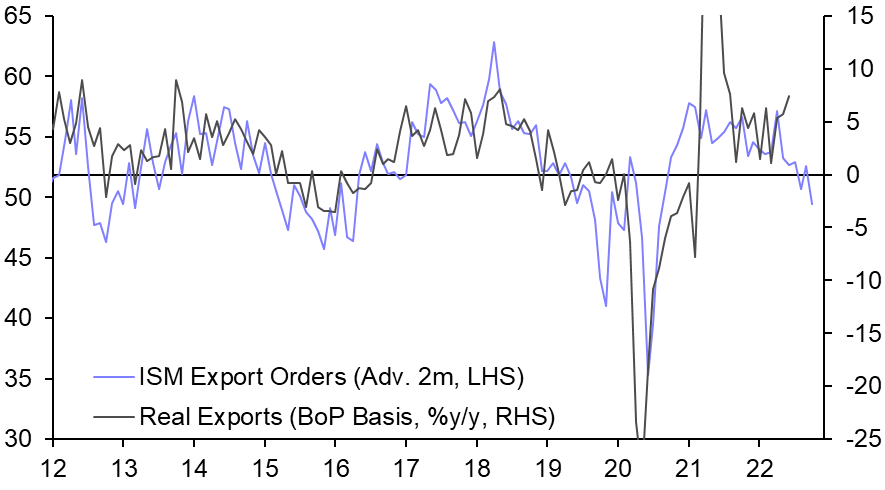
For the third quarter as a whole, exports look set for another strong rise with imports little changed. That would result in another boost to GDP growth from net trade. But the weakening global economy suggests that strength won’t last for much longer. (See Chart 3.)
|
Chart 3: ISM Export Orders & Real Exports |
|
|
|
Source: Refinitiv |
Economic Diary & Forecasts
|
Upcoming Events and Data Releases |
|||||
|
Release/Indicator/Event |
Time EDT (BST-5) |
Previous* |
Median* |
CE Forecasts* |
|
|
Mon 5th |
Labor Day Holiday – Markets Closed |
- |
- |
- |
- |
|
Tue 6th |
ISM Services Index (Aug) |
10.00 |
56.7 |
55.2 |
55.5 |
|
Wed 7th |
International Trade (Jul) |
08.30 |
-$79.6bn |
-$70.1bn |
-$70.0bn |
|
Fed Beige Book |
14.00 |
- |
- |
- |
|
|
Thu 8th |
Initial Jobless Claims (w/e Sep 3rd) |
08.30 |
232,000 |
- |
- |
|
Change in Consumer Credit (Jul) |
15.00 |
+$40.2bn |
+$32.5bn |
- |
|
|
Fri 9th |
No Significant Data Released |
- |
- |
- |
- |
|
Selected future data releases and events |
|||||
|
13th Sep |
Consumer Prices (Aug) |
08.30 |
|||
|
14th Sep |
Producer Prices (Aug) |
08.30 |
|||
|
15th Sep |
Retail Sales (Aug) |
08.30 |
|||
|
Industrial Production (Aug) |
09.15 |
||||
|
16th Sep |
Uni. of. Michigan Consumer Confidence (Sep) |
10.00 |
|||
|
21st Sep |
Fed Policy Announcement |
14.00 |
|||
|
*m/m(y/y) unless otherwise stated Sources: Bloomberg, Capital Economics |
|||||
|
Main Economic & Market Forecasts |
|||||||||
|
%q/q ann. (%y/y) unless stated |
Q2 2022 |
Q3 2022 |
Q4 2022 |
Q1 2023 |
Q2 2023 |
Q3 2023 |
2022 |
2023 |
2024 |
|
GDP |
-0.6 |
+3.0 |
+1.5 |
+1.4 |
+1.2 |
+1.5 |
(+1.9) |
(+1.5) |
(+2.0) |
|
CPI Inflation1 |
(+8.6) |
(+8.0) |
(+5.9) |
(+4.1) |
(+2.3) |
(+1.8) |
(+7.6) |
(+2.5) |
(+1.5) |
|
Core CPI Inflation1 |
(+6.0) |
(+6.0) |
(+5.6) |
(+4.6) |
(+4.0) |
(+3.5) |
(+6.0) |
(+3.8) |
(+2.4) |
|
Unemployment Rate,%1 |
3.6 |
3.6 |
3.7 |
3.8 |
3.9 |
4.0 |
3.7 |
3.9 |
3.9 |
|
Fed Funds Rate,%2 |
1.50-1.75 |
2.75-3.00 |
3.50-3.75 |
3.75-4.00 |
3.75-4.00 |
3.50-3.75 |
3.50-3.75 |
3.25-3.50 |
2.75-3.00 |
|
10y Treasury Yield,%2 |
2.97 |
2.90 |
3.00 |
3.00 |
2.90 |
2.80 |
3.00 |
2.75 |
2.75 |
|
S&P 5002 |
3785 |
3800 |
3600 |
3700 |
3800 |
3900 |
3600 |
4000 |
4400 |
|
$/€2 |
1.05 |
1.00 |
0.95 |
0.95 |
0.95 |
0.95 |
0.95 |
0.95 |
1.05 |
|
¥/$2 |
136 |
130 |
130 |
128 |
127 |
126 |
130 |
125 |
120 |
|
Sources: Refinitiv, Capital Economics. 1Period Average 2End Period |
|||||||||
Paul Ashworth, Chief US Economist, paul.ashworth@capitaleconomics.com