- China’s trade surplus has reached a record 1% of world GDP and looks set to rise further. It’s been driven, in part, by a surge in China’s exports – China has gained export market share across both low- and high-tech sectors, and with both advanced and emerging economies. Many emerging economies in Asia have preserved global market share by expanding exports to other destinations, helped by integration into Chinese supply chains. But manufacturers in advanced economies (mainly in Europe and to some extent Japan) have come under pressure, contributing to weak GDP growth and growing geopolitical tensions.
- China’s goods export volumes have surged by almost 70% since the pandemic, driving around a third of the economy’s growth. And given its growing share of the global economy, China’s surplus now carries major implications for the rest of the world.
- Three forces underpin China’s rising surplus. First, manufacturing investment has expanded rapidly, supported by industrial policy and a shift away from property. Second, weak household income growth and falling property prices have constrained domestic demand, amplifying excess capacity. And third, intense price competition at home has seen goods prices fall, allowing exporters to clear this excess abroad.
- China has gained export market share across most sectors, spanning both high‑tech industries targeted by policy, and lower‑tech, traditionally labour‑intensive goods. Gains have also been geographically broad, with particularly strong growth in exports to Europe and emerging Asia. Even where final assembly has shifted to other countries, China remains deeply embedded in global supply chains.
- The flipside has been growing pressure on exporters elsewhere, especially in advanced economies. Those across Europe have lost global market share across a wide range of products, pointing to a broad loss of competitiveness rather than isolated sectoral effects. By contrast, most emerging markets (notably Vietnam and Taiwan) have continued to gain share alongside China, helped by lower costs and closer integration into regional supply chains. Russia and Saudi Arabia are the main EMs that have lost some market share.
- Policy pushback is therefore intensifying. Anti‑dumping actions against Chinese goods have risen sharply, and we expect further tightening through targeted protection and industrial policy – particularly in Europe – rather than across-the-board tariffs. As China continues to gain global market share, the political pressure for such responses will likely grow across advanced and emerging markets. India will remain one of the most concerned about the impact of Chinese imports on domestic industry, prompting more protectionism.
- China’s surplus has also become a modest but persistent source of global disinflation. The 20% drop in Chinese export prices over the past three years has knocked a few tenths of a percent off headline CPI in advanced economies and continued falls are likely to keep a lid on global goods price inflation.
- China’s rising external surplus is driving global imbalances back toward pre-GFC levels. The threat to financial stability is lower now than it was then given that the lack of excessive leverage in the US private sector. Instead, the key implications of China’s growing surplus will be weak growth in advanced economy exporters including Germany and Japan and rising trade restrictions against China in key sectors.
China’s rising trade surplus and its global implications
China’s trade surplus is back in the spotlight. Exports are growing far faster than world trade, lifting China’s share of global markets to record highs and making external demand an increasingly important driver of growth. The result is intensified competitive pressure for manufacturers elsewhere, renewed trade frictions and a re-emergence of global imbalances. This trend is reshaping where growth is generated globally, keeping goods inflation down even as services inflation proves sticky, and increasing the risk of policy intervention in trade and industrial strategy.
In this Global Economics Focus, we set out why China’s export performance has strengthened so sharply, we examine which countries and sectors are losing or gaining market share as a result, we assess the likely policy response – particularly in Europe – and we consider what a persistently large Chinese surplus means for global inflation and macroeconomic risks over the medium term.
Rapid export growth propelling China’s economy
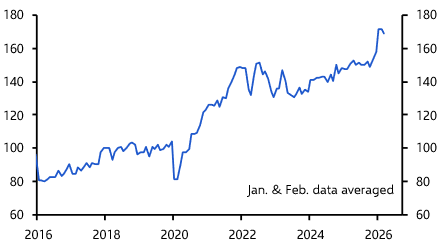
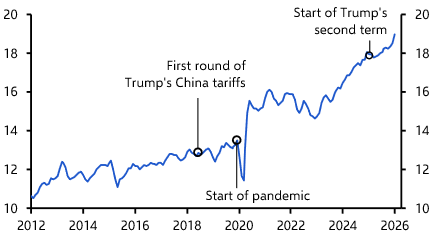
As of the start of this year, China’s export volumes were almost 70% higher than in 2019. (See Chart 1.) Global export volumes have risen by just under 20% over the same period, meaning that China has also gained significant global export market share. Indeed, its share of global export volumes has risen by more than 6%-pts from 13% in 2019 to over 19% in January of this year. (See Chart 2.)
|
Chart 1: China Goods Export Volumes (2019 = 100, seasonally-adjusted) |
|
|
|
Sources: LSEG, Capital Economics |
|
Chart 2: China Good Exports |
|
|
|
Sources: CEIC, CPB, Capital Economics |
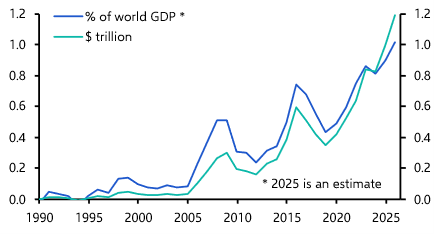
At the same time, China’s import growth has slowed, resulting in a steadily expanding external surplus. China’s goods trade surplus has risen to successive record highs, reaching $1.2 or around 1% of world GDP in 2025 (see Chart 3), the largest surplus as a share of global GDP of any country since the US in WWII.
|
Chart 3: China Goods Trade Balance |
|
|
|
Sources: CEIC, Capital Economics |
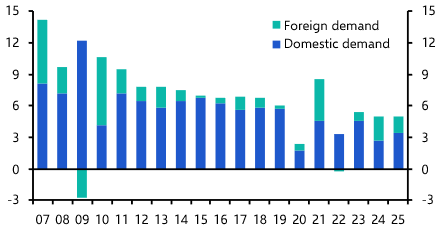
As export growth has surged and the trade surplus has grown, external demand has become an increasingly important driver of China’s economy. Between 2020 and 2025, exports drove around 30% of GDP growth, up from just 10% over the previous five years. And China’s export dependence has become even more significant recently – based on official GDP figures, external demand was responsible for 45% of growth in 2024 and around a third in 2025. (See Chart 4.) Our China Activity Proxy suggests that, in reality, China’s growth was substantially slower last year, implying an even greater export dependence.
|
Chart 4: China GDP Growth by Source of Demand |
|
|
|
Sources: LSEG, Capital Economics |
The drivers of export success
Three factors explain China’s rapid gains in global market share and its growing trade surplus. First, manufacturing investment growth accelerated significantly after the pandemic, averaging around 9% y/y between 2023 and 2024, up from a pre-pandemic average of 5% y/y. That partly reflected a policy-induced shift in investment away from real estate as the property sector tipped into crisis. Firms saw good reason to expand capacity at this time too, given the backdrop of strong global demand for many types of consumer goods during the pandemic. But strong manufacturing investment has also been the result of industrial policies aimed at boosting China’s technological development and self-sufficiency.
Second, domestic demand has weakened in China. Around half of China’s household wealth is stored in property. Existing home prices have fallen by more than 20% since the start of the property crisis in 2021, which has dealt a significant blow to household wealth. Income growth has also been lacklustre, weighing further on consumer confidence. All else equal, a slowdown in demand for manufactured goods implies an increase in excess capacity relative to domestic demand. In China, that's been amplified by the fact that the country’s manufacturing capacity has been expanding rapidly at the same time.
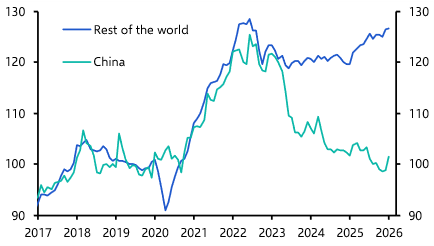
Finally, and as a result of this imbalance between domestic supply and domestic demand, Chinese manufacturers have engaged in fierce price wars both domestically and abroad. While the prices of exports from the rest of the world have been broadly stable since the pandemic-driven price surge levelled off from 2023, China’s export prices have fallen sharply. (See Chart 5.) That has boosted China’s export competitiveness, allowing Chinese manufacturers to offload their excess supply onto the global market.
|
Chart 5: Goods Export Prices (US$, 2019 = 100) |
|
|
|
Sources: CEIC, CPB, Capital Economics |
Gains across sectors and destinations
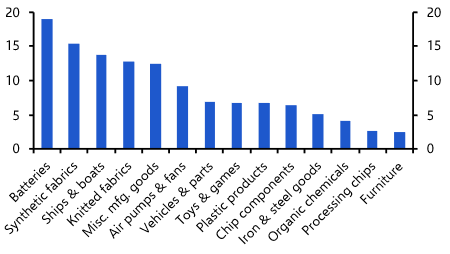
A goods-level breakdown of China’s exports shows that China has gained global export market share across most sectors since the pandemic. (See Chart 6.) The products that have seen the biggest gains in export market share include many of the high-tech, strategically important goods like batteries, semiconductors and vehicles that have been the main focus of the leadership’s industrial policies. (See Chart 7.) These sectors have benefited from strong policy support which has allowed Chinese firms to rapidly expand production capacity.
But China has also seen some of its biggest gains in global market share in lower-tech goods like textiles, toys and games, and furniture. This partly reflects the impact of the leadership’s push for automation in traditionally labour-intensive industries. China’s export gains across product types are also a clear sign of the impact of weak domestic demand – fierce competition among firms within China has boosted the competitiveness of Chinese goods in global markets.
|
Chart 6: China Global Export Market Share by Product* (%, 2024 vs. pre-pandemic average) |
|
|
|
|
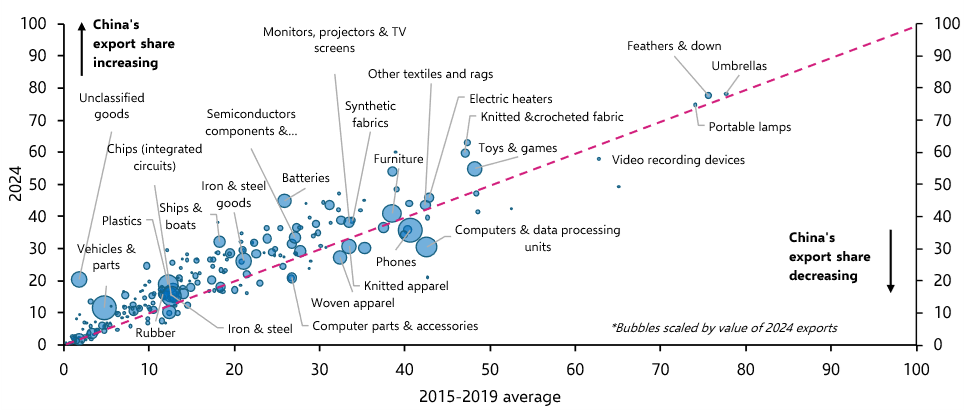
The implication is that, even if the government makes good on the commitments in the recent Five-Year Plan to rein in some of the excesses of industrial policy (see here), China is still likely to continue gaining global export market share. In the absence of a significant ramp-up in policy support for domestic consumers (which looks unlikely), Chinese manufacturers will continue to shift excess supply to external markets.
|
Chart 7: China Gains in Global Export Market Share by Product (%-pts, 2024 vs 2015-19 avg.) |
|
|
|
Sources: LSEG, Capital Economics |
The few sectors in which China has lost global export market share also tell an interesting story. Consumer electronics (in particular phones and computers) as well as clothing and footwear stand out. Production in these sectors has shifted towards other emerging markets, mainly Asian economies, in recent years. But China remains the dominant supplier of intermediate inputs in the production process, including semiconductors and synthetic fabrics, as well as manufacturing equipment. And Chinese investment in Asian economies like Vietnam, Malaysia, and Thailand that specialise in the final assembly of consumer electronics and clothing manufacturing has picked up.
This points to both greater integration of regional supply chains, and China’s growing presence in third markets, rather than an outright displacement of Chinese manufacturers. This supply chain integration is demonstrated by the fact that China’s exports to ASEAN have more than doubled over the past five years, outpacing those to the rest of the world. (See Chart 8.)
|
Chart 8: China Goods Exports by Destination |
|
|
|
Sources: CEIC, CPB, Capital Economics |
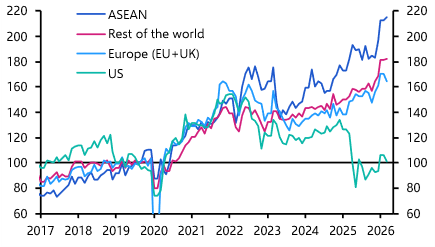
While ASEAN economies have seen the biggest increase in Chinese imports, China’s export surge has had an impact on most of the world. Exports to Europe are now around 70% above their pre-pandemic level, while exports to most of the rest of the world are up over 80%. (See Chart 8 again.) The exception is the US, where the Trump administration’s import tariffs have resulted in a sharp fall in imports from China.
A major headwind for DM manufacturers
The increase in Chinese exports impacts different economies in different ways:
• Higher Chinese exports intensify competition for domestic manufacturers in the home market;
• Chinese firms compete more directly with exporters from other countries for the same overseas customers in third markets;
• Non-Chinese firms that sell into the Chinese market face tougher competition from increasingly competitive domestic producers.
China ran a goods trade surplus with around 75% of the world’s economies in 2025 and the size of that surplus increased in the vast majority of countries last year. It would be easy to assume that the increase in China’s trade surplus has hurt manufacturers across the world that now face tougher competition with goods produced in China. On the face of it, this would appear to be the case for emerging markets, which have absorbed most of China’s export surge since 2022, particularly across Asia. (See Chart 9.)
|
Chart 9: China Goods Trade Surplus ($bn) |
|
|
|
Sources: LSEG, IMF, Capital Economics |
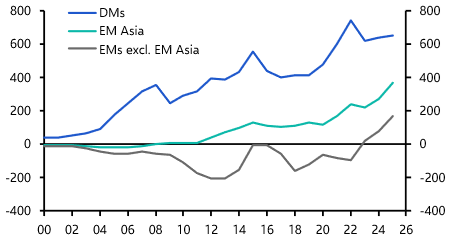
However, while China’s growing trade surplus has squeezed domestic EM manufacturers to an extent, it hasn’t been a purely negative development. Indeed, many EMs have continued to gain global export market share, notably Taiwan and Vietnam. (Chart 10 shows the change in global export market share across major economies between 2019 and 2025 in nominal, US$ terms.)
Some of this increase in global market share is related to AI investment (which has supported Taiwan’s exports). But Chinese firms have also invested in new production facilities and increased their integration into supply chains, particularly in parts of Asia, which has helped to grow these countries’ exports to other destinations.
|
Chart 10: Global Export Market Share |
|
|
|
Sources: LSEG, CPB World Trade, Capital Economics |
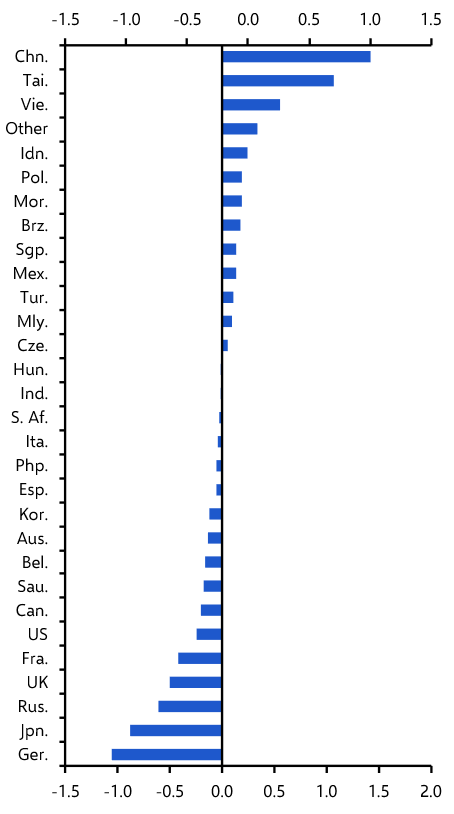
Several other EMs – notably Poland, Morocco, Malaysia and Turkey – have also seen their trade balances with China deteriorate while their global export market share has risen (in both nominal and real terms), as they have integrated more deeply into regional supply chains. The main EMs that have lost market share since 2019 include Russia and Saudi Arabia. Overall, though, it appears that China’s rise has coincided with – rather than displaced – export growth in parts of the EM world.
Instead, China’s increase in global export market share appears to have had the biggest impact on advanced economies, particularly in Europe. The countries that have experienced among the largest declines in global export market share in nominal terms since 2019 include Germany, Japan, the UK and France followed by Cananda and the US. Many of the DMs that show up as the worst performers in Chart 10 have experienced falls in global export market share in both nominal (i.e. US$) and real terms. Japanese firms have cut their export prices in recent years which has weighed on Japan’s market share in nominal terms, but Japan’s share of global export volumes has been broadly unchanged.
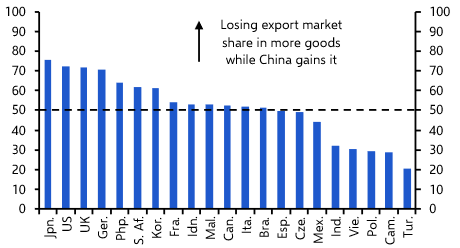
A more granular analysis reinforces this EM vs. DM divergence. Looking at around 1,200 goods at the four-digit product level in US$ terms, China has gained global export market share in around 70% of these goods (these products refer to those that sit above the dashed line in Chart 6 earlier). We’ve looked at whether China’s gains in these goods have coincided with losses for other countries.
Countries such as Turkey, Poland, Vietnam and India have lost export market share in US$ terms in only around one-third of these goods. Or, to put it differently, they have gained market share in 70% of the goods in which China has also gained market share. Advanced economies – e.g. Japan, Germany, the US and the UK – have lost market share in value terms in roughly 70% of the products where China has gained market share. (See Chart 11.) We’ve analysed the challenges for euro-zone manufacturers in detail here and the threat from Chinese EVs to Japan’s car industry here.
|
Chart 11: Share of Exports for which Global Market |
|
|
|
*~1,200 products Sources: LSEG, Intracen, Capital Economics |
This pattern is even clearer across broader product groups. Chart 12 shows the changes in global export market share across groups of EMs and DMs in 16 key product areas. China’s increases in global export market share in motor vehicles, household appliances, chemicals, furniture and capital goods have largely come at the expense of G7 exporters, with Germany and Japan among the biggest losers. By contrast, several of the stronger-performing EM exporters – a group that includes Poland, Turkey, Vietnam and India – have generally expanded their presence in these same sectors.
|
Chart 12: Global Export Market Share (by Product Category, %-pt Change 2019 to 2024) |
|
|
|
Sources: LSEG, Intracen, Capital Economics |
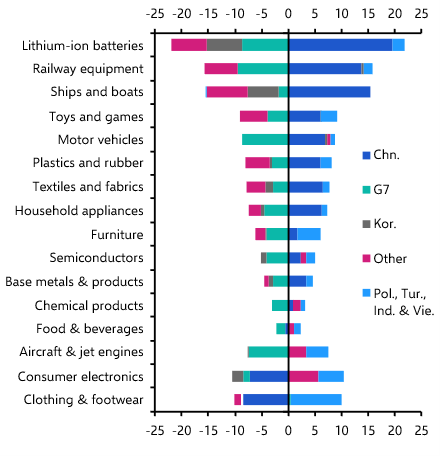
There are some product areas where China’s export growth has been disruptive more broadly. In areas such as batteries, textiles, household appliances, toys and games, railway equipment and ships, a wider set of countries – beyond the G7 – have lost some market share. This includes smaller EMs and DMs, but the losses have been concentrated across the euro-zone. And in the relatively few goods where China has lost market share since 2019, notably consumer electronics and clothing and footwear, the gains have been concentrated across EMs – mainly in Poland, Vietnam, Turkey or India.
Overall, while it is possible that export growth in many EMs could have been stronger in the absence of China’s rapid gains, there is little indication of a broad loss of competitiveness. For the most part, the key story is that advanced economies appear to have been the biggest losers from China’s export gains, as G7 economies have experienced broad-based declines in their global export market share in recent years. This reflects increased competition with China in third markets as well as in China itself, which has weighed on their market share.
Government pushback set to increase
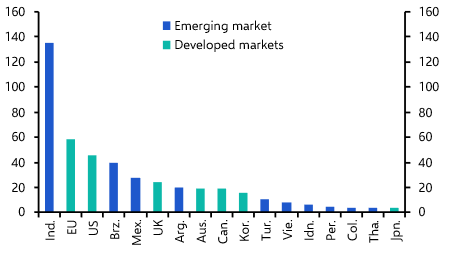
Pushback to China’s export strength has taken place across a mix of advanced and emerging economies. According to data compiled by Global Trade Alert, India has been more aggressive than any country or bloc in enacting anti-dumping measures against China since 2020, followed by the EU, the US and Brazil. (See Chart 13.) Excluding India, the number of anti-dumping investigations in the past two years was more than double that in the previous four.
|
Chart 13: Anti-Dumping Investigations against China (Total, 2020 to 2025) |
|
|
|
Sources: Global Trade Alert, Capital Economics |
Given their loss of global market share, advanced economies appear to have the greatest concerns over China undermining domestic industry. Added to this is the perceived security risk of becoming too dependent on imports of Chinese goods in strategically important areas, including telecommunications networks, chips and, increasingly, green technology.
As we argued in a recent report, we expect the EU to impose more protectionist trade policies on specific industries in the coming years to slow the decline of European manufacturing. We think this will most likely take the form of trade defence policies and stricter local content rules rather than across-the-board tariffs.
India appears the most concerned across EMs about the threat of Chinese imports to domestic industry. We suspect the challenge of protecting domestic industry will prompt officials to impose more protectionist policies across a range of sectors over the coming years. But pushback from a wider group of EMs will likely grow over time too, if China continues to expand its exports into EMs and/or if China eats into their export market share in foreign markets. Both would increase competition with domestic industry, potentially limiting the ability of EMs to grow their own manufacturing sectors.
While a worsening of a country’s trade balance with China and a deterioration in its global export market share will feed into any potential pushback against Chinese goods in EMs, other factors will be important too. For example, if China continues to expand exports to a country while investing in production facilities and increasing outbound FDI (as appears to have happened across large parts of Asia), any pushback might be limited. What’s more, those EMs that are dependent on Chinese demand for their own exports (mainly commodity producers) are less likely to take significant protectionist measures. (See here.)
A modest disinflationary force
China’s export surplus has already contributed to global disinflation, albeit somewhat less than you might assume. In the past three years, Chinese export prices have fallen by close to 20%. (See Chart 5 again.) Given that imports from China account for 1-2% of final consumption in most advanced economies, the direct arithmetic impact has been to reduce the level of headline CPI by around 0.2-0.3% over the three years.
This probably understates the overall effect. Since Chinese goods are heavily embedded in global value chains, weaker export prices reduce the cost of intermediate inputs and final goods produced elsewhere. They also add to competitive pressures and encourage domestic producers to cut their own prices. Studies that account for these channels find that a 7-10% fall in Chinese export prices can lower euro-zone CPI by around 0.2-0.3% over two years, implying that a near-20% fall might have knocked 0.3-0.5% off headline CPI over three years.
Looking ahead, persistent overcapacity and a rising export surplus should keep Chinese export prices drifting lower. This will not drive inflation materially below target, not least because the pace of decline would have to accelerate to reduce inflation further. That seems unlikely given the very steep falls of the past few years and the fact that exporters’ margins are already squeezed. However, the declining price of imports from China should help keep goods inflation subdued. (See here.)
The US remains the exception. There, tariffs have more than offset the downward pressure from cheaper Chinese exports, and they are unlikely to be fully unwound even under a new administration, limiting any future disinflationary spillovers.
Onus for rebalancing lies on both sides
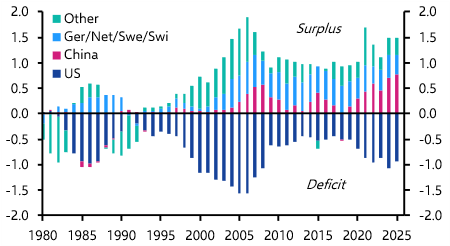
The persistence of China’s large external surplus has important implications for global imbalances. As a matter of accounting, stronger net exports in one part of the world must be offset elsewhere. Chart 14 illustrates this clearly: the renewed rise in China’s current account surplus over recent years has been mirrored by widening deficits in the US. At the same time, Europe’s surplus has been eroded, reflecting higher energy costs and its struggles competing with exports from China (alongside a slightly more positive story about recovering domestic demand in the region’s southern economies). In aggregate, global current account balances are now close to levels last seen before the global financial crisis, even if the composition differs somewhat.
|
Chart 14: Current Account Balances (% of World GDP) |
|
|
|
Sources: LSEG, Capital Economics |
Historically, such imbalances have often proved destabilising. In the mid‑2000s, large surpluses in China and parts of Europe were recycled into deficit economies through global financial markets, compressing interest rates, fuelling asset price booms and encouraging excessive private sector borrowing. When those capital flows reversed, deficit countries faced abrupt funding stress and deep financial retrenchment. In the early 1970s, growing US deficits alongside rising surpluses in Europe and Japan created mounting currency pressures, culminating in the collapse of the Bretton Woods system and a period of monetary instability and high inflation. And in the late 1970s, oil-driven surpluses in exporting countries were recycled through the banking system, contributing to stagflation in advanced economies and laying the foundations for the emerging market debt crises of the early 1980s.
This time, however, the risks look different. The counterpart to China’s rising surplus has again been a widening US deficit. But that deficit has been financed primarily by public borrowing rather than private leverage. While this could raise financial stability risks if yields spiked, comfort can be taken from the fact that US external liabilities remain overwhelmingly denominated in dollars and are absorbed by deep, liquid capital markets. So for now, there are few signs of the kind of fragile cross‑border funding structures that characterised the pre‑2008 period.
That said, the absence of immediate financial stress does not mean the imbalances are benign. The adjustment burden is increasingly being shifted into the real economy and the political sphere. Persistent Chinese surpluses imply continued pressure on manufacturing sectors elsewhere and a further skewing of global demand towards the US. Over time, this configuration looks unlikely to prove sustainable. Rather than ending in a classic balance of payments crisis, today’s global imbalances are more likely to generate prolonged economic and political tensions – including pressure for trade restrictions, industrial policy and fiscal retrenchment.
Conclusion
With domestic consumption weak and industrial capacity continuing to expand, China is set to remain a dominant force in global goods markets. The implications are far-reaching. Advanced economy exporters including Germany and Japan will keep struggling to compete with rising Chinese supply, adding to growth headwinds from demographics and other structural problems. Geopolitical tensions and restrictions on China’s exports will intensify in strategically sensitive sectors. And at the same time, the global flood of manufactured goods will keep underlying goods inflation subdued, albeit with periodic volatility as trade tensions flare and recede.