At the start of the war in Iran, we outlined two scenarios for how the conflict might evolve and how the global economy would be affected. In our baseline scenario, we assumed that the conflict would draw to a close by the start of May and that energy supplies through the Strait of Hormuz would resume shortly thereafter. In our adverse scenario, we assumed that the conflict would persist through the first half of the year, that there would be extensive damage to energy infrastructure and that the Strait would not begin to reopen until the third quarter. In both cases, the principal transmission mechanism to the global economy was through energy supplies and energy prices.
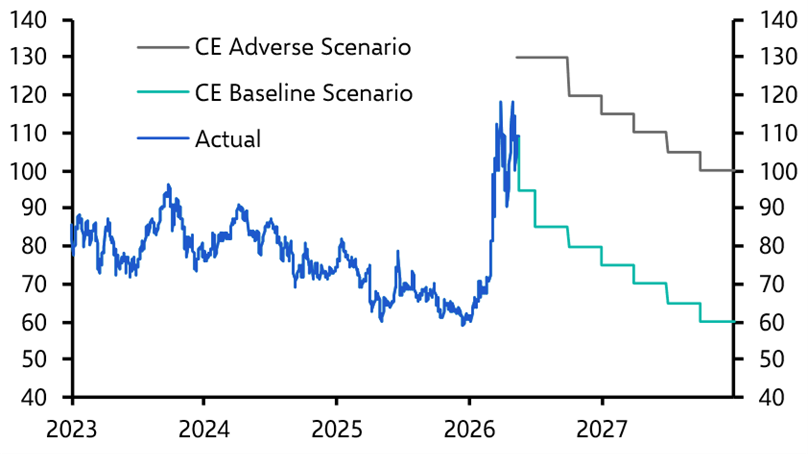
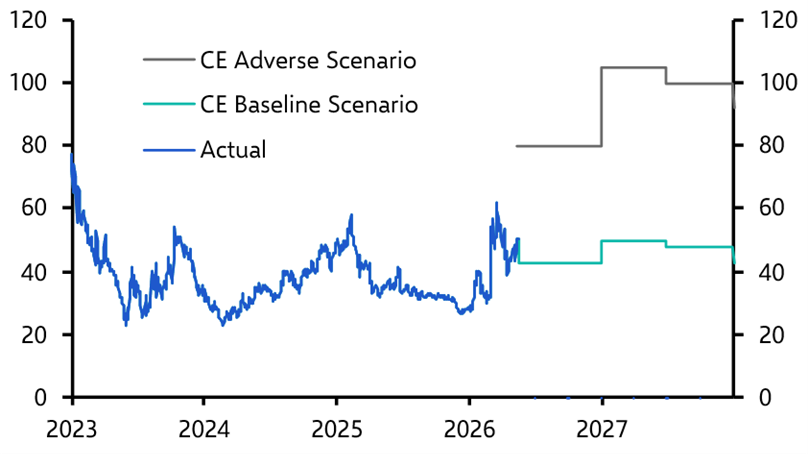
For now, energy prices in the spot market remain broadly consistent with our baseline scenario. (See Charts 1 & 2.) However, we may be approaching a tipping point at which outcomes shift rapidly towards a more adverse scenario.
|
Chart 1: Brent Oil Price (US$ Per Barrel) |
|
|
|
Sources: LSEG Data & Analytics, Capital Economics |
|
Chart 2: European Natural Gas Price (€ MW/h) |
|
|
|
Sources: LSEG Data & Analytics, Capital Economics |
Digging in
While the fighting did indeed cease in early April, slightly earlier than the assumptions in our baseline scenario, the Strait remains effectively closed. Moreover, both the US and Iran are digging in in ways that make it difficult to foresee a reopening any time soon.
The Iranians clearly view control over the Strait as a key – indeed perhaps their only – source of leverage over the US (and the rest of the world). They are unlikely to relinquish that leverage without credible guarantees that further attacks will not follow. Meanwhile, President Trump has doubled down on the view that Iran must significantly curtail its nuclear programme as part of any longer-lasting deal to end the war and reopen the Strait. It is therefore difficult to see how the current impasse is resolved.
In this sense, oil and natural gas prices appear at odds with the seemingly rising risk of a more prolonged disruption to supply. In part, this reflects the fact that markets are still pricing in the possibility that the Strait reopens relatively soon, allowing supplies to normalise and prices to fall back. This remains possible.
The price most widely reported in markets and in the press is the so-called front-month contract – currently the July contract for Brent crude. This rolls forward by one month at the end of each month. Markets are signalling that supply conditions for delivery in July have tightened materially but not catastrophically, with Brent crude now trading at around $110 per barrel (pb). This tightening has been mitigated to some extent by inventory drawdowns and the rerouting of some production through pipeline infrastructure, both of which have helped support supply in the short term.
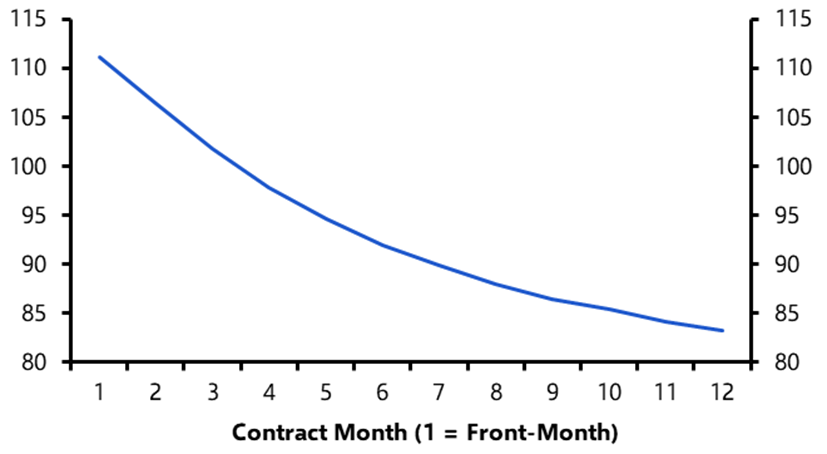
However, inventories cannot be drawn down indefinitely. Although futures prices are not an exact reflection of market expectations for front-month prices later this year, the downward slope of the curve suggests that supply conditions are expected to improve. (Chart 3.) If that improvement fails to materialise soon, prices could rise sharply. At the current pace of drawdown, commercial oil stocks could reach critically low levels by the end of June.
|
Chart 3: Brent Crude Futures Curve (US$ Per Barrel) |
|
|
|
Sources: LSEG Data & Analytics, Capital Economics |
What a more adverse scenario might look like
Accordingly, unless there is a breakthrough that reopens the Strait in the next few weeks, our baseline scenario will no longer be tenable. We may not move all the way to the adverse scenario we sketched out in early March, but we would move closer to it. In that scenario we assumed a decline in global oil exports of nearly 10% this year, alongside a reduction of more than 10% in LNG exports. On this basis, we argued that Brent crude would rise to $130pb at the start of Q3 before dropping back gradually to $120pb by the end of the year. The economic damage would be considerably more severe than in the baseline scenario, although the relationship is unlikely to be linear. As prices rise further, the outlook becomes increasingly difficult to forecast.
One thing we can be reasonably sure about is that Asia and Europe will be hit harder than the US. The crisis has so far left China in something of a sweet spot, with the rise in energy prices increasing global demand for its green tech exports without doing material damage to the global economy. If global energy prices rise sharply further, the global consumers that are currently eyeing up Chinese-made EVs and solar panels may instead pull back on their spending altogether, which would hurt all of China’s exporters.
For the rest of Asia, those governments currently slowing the pass-through of higher global energy prices through subsidies may decide that to continue to do so would be too costly (India last week raised local fuel prices for the first time since the crisis began). More central banks in the region could follow the Philippines’ lead with interest rate hikes. The risk of supply shortages of energy and non-energy products would also grow, curtailing activity – although semiconductor fabs would be spared.
Like Asia, Europe is vulnerable because it is a large net energy importer. That said, the impact of a prolonged closure of the Strait of Hormuz on Europe’s economy may prove somewhat smaller than we initially assumed, given that European gas markets have so far been less affected than we feared. This is because demand for natural gas is seasonally weak and Asian buyers directly affected by the loss of Qatari supply appear less willing and/or able to bid up prices. Even so, it is likely that in a more adverse scenario inflation would rise to something like 6-7% in the UK and euro-zone, and both the European Central Bank and Bank of England would raise interest rates – perhaps by around 100bps. With US inflation also likely to rise toward 5%, the Federal Reserve may also be forced to tighten policy, although we would expect new Chair Kevin Warsh to oversee only a token 25bp increase to 3.75-4.00%. US GDP may grow by something like 1.5% this year, rather than the 2.2% we forecast in our baseline scenario.
Needless to say, a lot remains uncertain and we will continue to monitor the situation closely. The central point, however, is that in the absence of a deal to reopen the Strait within the next couple of weeks, we are likely to shift our forecasts towards something closer to our adverse scenario.
In case you missed it
Markets have become attuned to the inflation risks stemming from the conflict, but not around the growth risks. That could change if the Strait remains closed for much longer.
Don't expect a significant supply response from the US majors to offset the oil shortfall.
Our Wednesday online Drop-In briefing will answer client questions about the opportunities around the structural shift in CRE demand toward alternative sectors.