- While the valuation of the S&P 500 appears high in absolute terms – even after the falls in the index in 2022 so far – it seems far less stretched once the still historically low real yields of US Treasuries are considered. And it would probably take a much larger adjustment in Fed policy than we anticipate over the coming years to change that markedly. With this in mind, although we expect the S&P 500 to decline a bit further over the next year or so, we are not anticipating a big multi-year bear market in US equities.
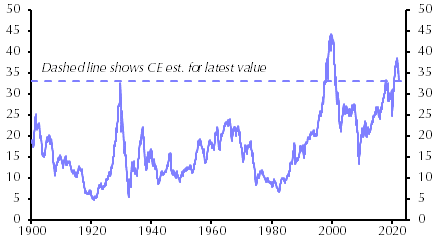
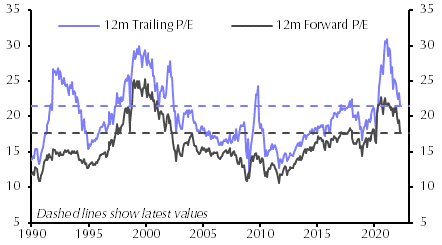
- Compared to its own history, it is hard to argue that the US stock market is not highly valued in absolute terms. One widely cited measure, Shiller’s cyclically adjusted price/earnings ratio (CAPE) of the S&P 500 currently stands at just over 33 by our reckoning, lower than Shiller’s estimate of 38.6 for June 2021, but higher than at almost any other point bar the peak of the dot com bubble. (See Chart 1.) The index’s 12m trailing and 12m forward price/earnings (P/E) ratios appear less elevated, mainly because growth in earnings per share (EPS) has been very strong over the past decade or so, and is expected to remain rapid in the coming year. (See Chart 2.) Even so, on these second two counts, the valuation of the S&P 500 has also rarely been higher outside of the dot com boom and bust around the turn of the millennium.
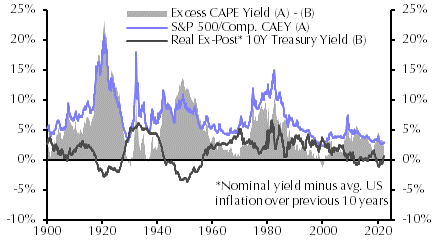
- However, compared to the valuations of US Treasuries, the S&P 500’s valuation seems far less concerning. The cyclically adjusted earnings yield (CAEY), the reciprocal of Shiller’s CAPE, can be split into two parts. The first is the real ex-post long-term Treasury yield. The second, residual, component is Shiller’s excess CAPE yield, essentially a measure of the equity risk premium. As Chart 3 shows, the excess CAPE yield, which we estimate to be ~2.4% at present, does not seem especially low compared to its own history, and is a long way from turning negative, as it did during the dot com boom and prior to the great crash of 1929.
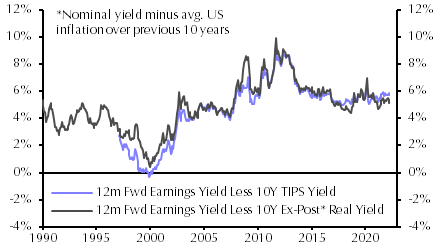
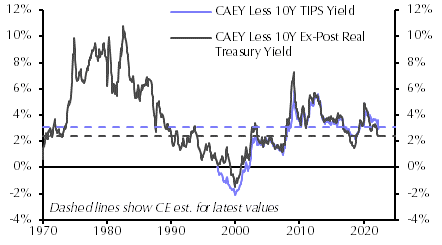
- What’s more, comparing the CAEY with the ex-post real long-term Treasury yield may slightly understate equity risk premia, and thus overstate the relative valuation of the S&P 500. This is because investors currently expect US inflation to be higher in the coming years than it was over the past decade. As a result, ex-ante measures of real long-term Treasury yields, such as the 10-year US TIPS yield, are lower than the ex-post real yield. The choice of measure for the real long-term Treasury yield usually made little difference to estimates of the excess CAPE yield since the inception of TIPS in 1997. (See Chart 4.) But if we substituted in the 10-year TIPS yield, the current excess CAPE yield would be a bit higher, at just shy of 3.1%.
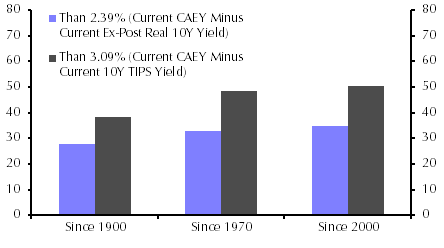
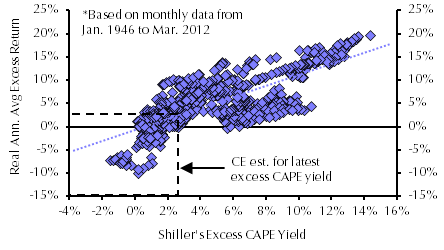
- Admittedly, measures of the excess CAPE yield have fallen of late, compressed by the sharp rise in the Treasury yield. But even after the latest decline, Shiller’s excess CAPE yield has been lower nearly 30% of the time since 1900, and has been lower even more frequently if we look back over shorter windows. (See Chart 5.) Compared to the 10-year TIPS yield, the current CAEY of the S&P 500 is close to the middle of its historical range. On past form, the current level of the excess CAPE yield also remains consistent with US equities outperforming Treasuries in the coming decade, albeit not by a wide margin. (See Chart 6.) If, rather than the CAEY, we compare real Treasury yields with the 12m forward earnings yield of the S&P 500, it is even harder to argue that US equities are very highly valued relative to Treasuries. (See Chart 7.)
- Of course, the idea that US equities are not highly valued relative to Treasuries will be of limited comfort to investors if bond yields continue to surge, especially since we find it hard to see equity risk premia falling much further at this stage of the economic cycle. What’s more, the analysis above has only discussed the valuation of the S&P 500. EPS growth may also underwhelm expectations if economic growth is weak.
- In our view, Treasury yields will continue to rise, albeit less rapidly than they have in recent months. We forecast that the 10-year nominal Treasury yield will end this year at 3.25%, and peak at ~3.75% around the middle of 2023 (see here), with that climb driven mainly by higher real yields. That would put further downward pressure on the S&P 500’s valuation. Meanwhile, although we do not anticipate a recession in the US, we think its economy will grow more slowly than most expect over the next few years. (See here.) As such, we suspect that growth in US corporate earnings will disappoint analysts’ still rather rosy expectations, particularly in a world where higher input and labour costs are putting pressure on margins.
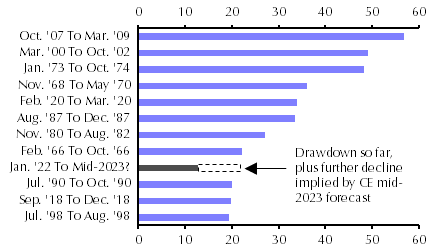
- This informs our forecast that the S&P 500 will fall from ~4,200 at present to 4,000 by end-2022, and 3,750 by mid-2023, as Treasury yields rise further and growth underwhelms. We expect this to mark a low point in the index, and that it will recover thereafter, as the Fed’s tightening cycle comes to an end and the real 10-year yield falls back. Altogether, that would mean a peak-to-trough fall in the S&P 500 of just over 20% from its all-time high in January. Chart 8 shows how this might compare to other major drawdowns in the index over the past six decades or so. While a steep decline overall, the drop we envisage would be far smaller than in the largest S&P 500 bear markets. Many of these accompanied either major recessions, or the S&P 500’s valuation starting from far loftier heights relative to real long-dated US Treasury yields.
|
|
|
|
|
|
|
|
|
|
|
|
|
|
|
|
|
|
|
|
|
|
|
|
|
|
Sources: |