Stagflation Nation
Q3 UK Economic Outlook

Although the UK economy has proved resilient to the cost of living crisis, which is coming to an end, we think the cost of borrowing crunch will send it over the edge.
This is a sample of our latest quarterly UK Economic Outlook, originally published on 19th June, 2023. Some of the forecasts contained within may have been changed since publication. Access to the complete report, including extensive forecasts and near to long-term analysis, is available as part of a subscription to our CE Advance premium product or to our dedicated UK Economics coverage.
As the recent problem of higher inflation and slower economic growth than elsewhere is largely due to the lingering effects of the pandemic and Brexit, we think the UK will probably look like the stagflation nation for another couple of years yet.
- We think the UK’s bigger labour supply shortfall will mean inflation takes longer to return to the 2.0% target than in the US and the euro-zone. That’s why we expect UK GDP to be weaker and rates to stay higher than in the US and the euro-zone for two more years.
- While real GDP rose by just 0.2% in the year to Q1 2023, the economy has held up better than most had expected and, unlike Germany, has avoided a recession. This was only possible due to households spending some of their pandemic savings and the tight labour market/government handouts supporting household incomes.
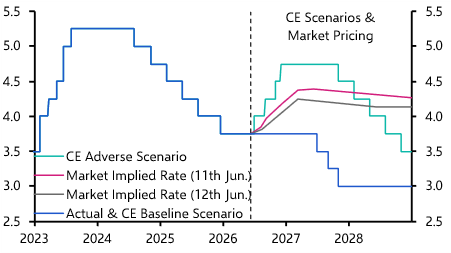
- But we still expect GDP to contract later this year. Indeed, we think that inflation will drop to the 2.0% target only if the Bank triggers a recession by raising rates from 4.50% now to 5.25% and keeps rates there until late-2024.
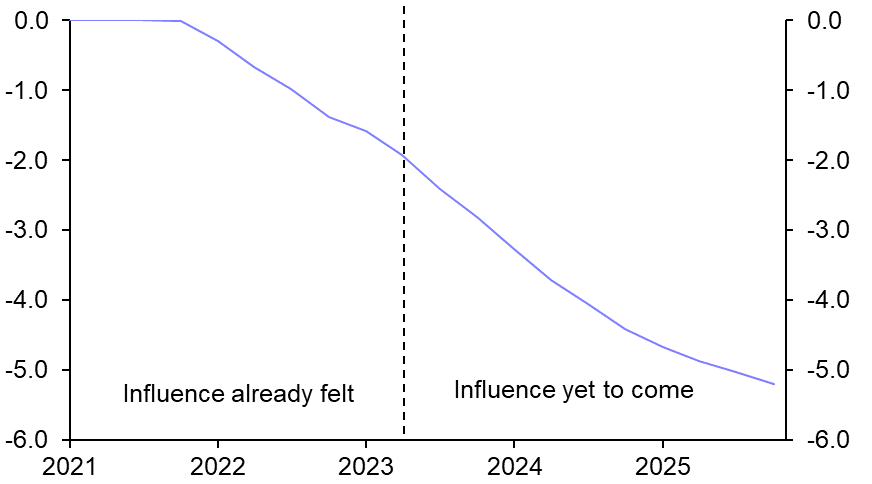
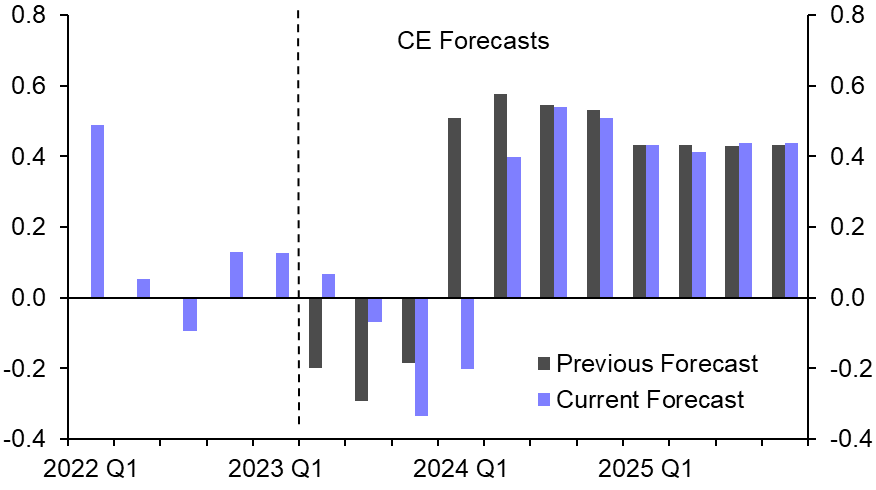
- Our forecast that Bank Rate will rise to 5.25% suggests the total drag on the level of real GDP will be around 5%. And we estimate that around 60% of the drag on real activity from the rise in rates has yet to bite. (See Chart 1.) The drag on the quarterly rate of real GDP growth over the next year may be about 0.2ppts bigger than over the past year. (See Chart 2.)
|
Chart 1: CE Estimate of Influence on Real GDP of Rise in Interest Rates from 0.10% to 5.25% |
Chart 2: CE Estimate of Influence on % |
|
|
|

- What’s more, we still believe that a period of economic weakness is necessary to reduce wage growth and core CPI inflation to rates consistent with the 2.0% inflation target. Job mismatches caused by Brexit and the bigger hit to the UK’s labour supply since COVID explain why wage growth in the UK has been faster than elsewhere.
- Admittedly, some falls in wage growth from April’s rate of 6.5% and in core CPI inflation from April’s rate of 6.8% will probably happen naturally and without much economic pain. Indeed, a further fall in CPI inflation due to lower energy and food inflation will shrink that part of wage growth that is being driven by actual inflation or the inflation expectations of both employers and employees.
- But our view is that to get wage growth and core inflation down to levels consistent with the 2.0% inflation target, the Bank needs to keep rates high to loosen the labour market enough, weaken wage growth enough and stamp down on any rises in price and wage expectations.
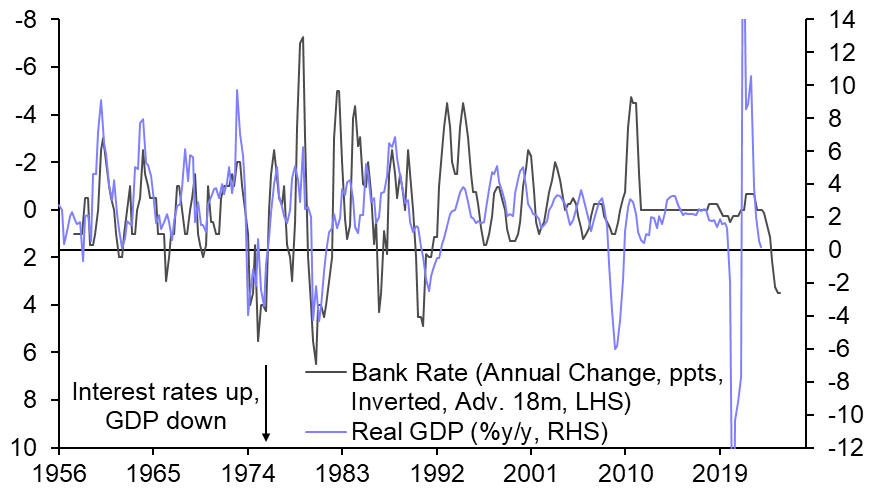
- This could be achieved by real GDP growing at a slower rate than the economy’s potential for a prolonged period, rather than a recession. But it would be rare for rates to rise so far, so fast without triggering a recession. (See Chart 3.) Our hunch is that a recession is more likely.
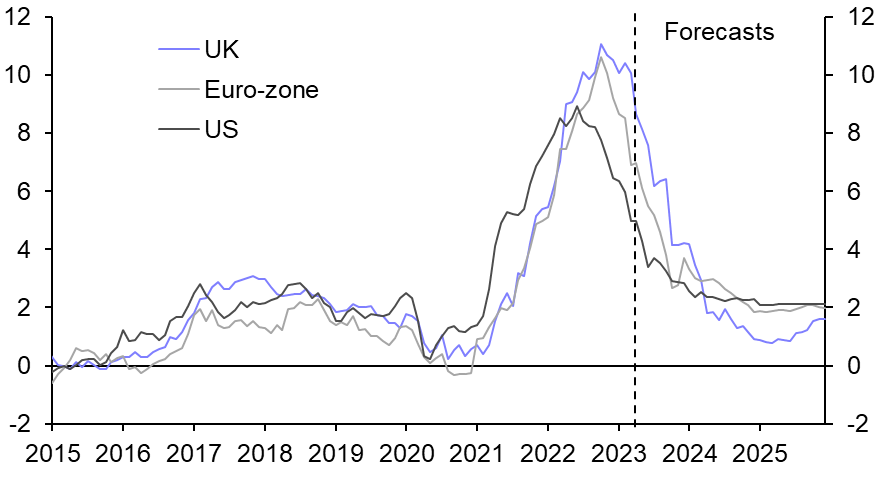
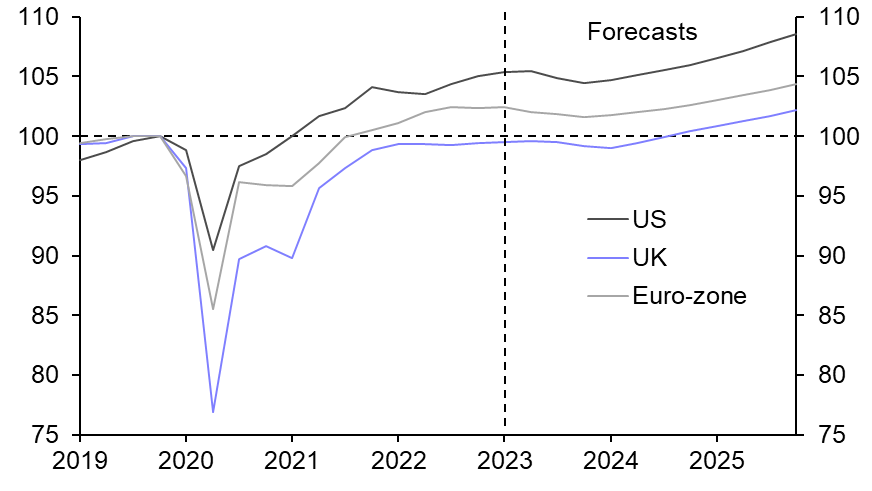
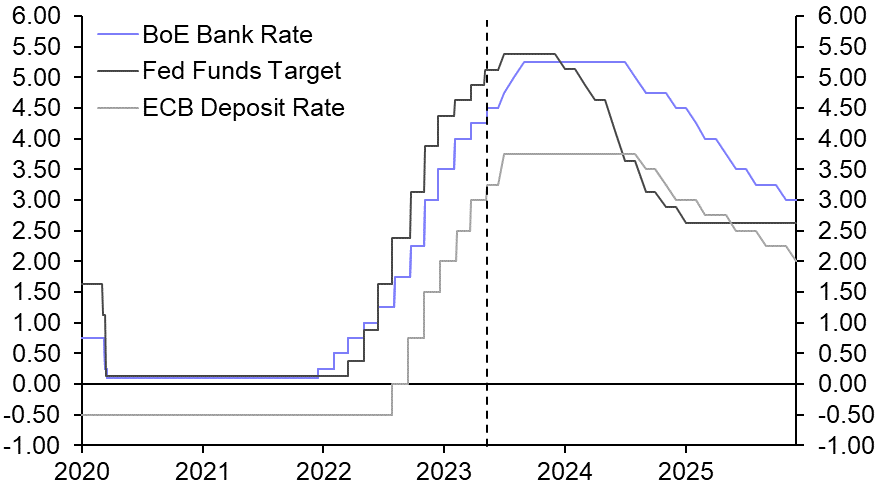
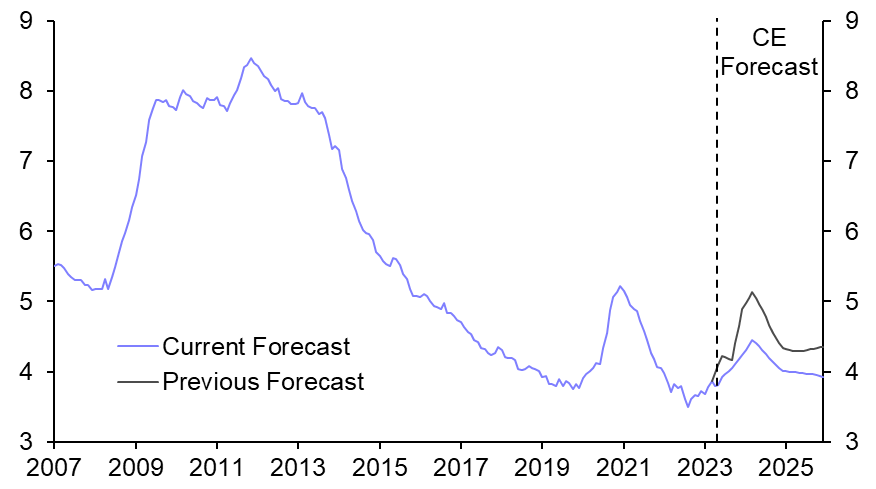
- This leaves our GDP forecast below the consensus forecast, with only two of the other 28 forecasters polled by Bloomberg in June predicting a recession. And due to inflation taking longer to return to the 2.0% target than in the US and the euro-zone, we expect UK GDP to remain weak and rates to stay higher than in the US and the euro-zone for two more years. (See Chart 4.)
- That justifies the UK’s label of the “stagflation nation”. (See Chart 5 & 6.)
|
Chart 3: Real GDP & Bank Rate |
Chart 4: CPI Inflation (%) |
|
|
|
|
Chart 5: Real GDP (Q4 2019 = 100) |
Chart 6: Policy Interest Rates (%) |
|
|
|
- However, we now think the recession will start later, in the second half of this year, and that the peak-to-trough decline in real GDP will be 0.5% rather than 1.0%. (See Chart 7.) That would mean this recession looks even milder compared to previous ones. And we now assume the unemployment rate rises from 3.8% in April to a peak of 4.5% (5.0% previously), which would be unusually low when compared with recent downturns. (See Chart 8.)
- That said, the growing risk of a hard landing in the housing market means that the chances of a bigger recession are perhaps greater in the UK than elsewhere.
|
|
|
|
|
|
|
|
Sources: Refinitiv, Bank of England, Capital Economics |
From a Capital Economics report written by Paul Dales, Ruth Gregory, Ashley Webb, Alex Kerr and Anna Padt published on 19th June, 2023.

Make faster informed decisions
CE Advance, our new premium product, equips organisations with actionable macroeconomic data and insight to stay ahead of the curve.