
Q3 Asset Allocation Outlook
We think the future remains bright for US equities

We forecast that equities in the US will continue to fare especially well through the end of 2025. This is because we think that a bubble will keep inflating in the meantime amid growing enthusiasm about AI, benefitting the US stock market disproportionately.
These are just some of the key takeaways from our latest quarterly Asset Allocation Outlook, originally published on 1st July, 2024. Some of the forecasts contained within may have changed since publication. Access to the complete report, including detailed forecasts and near to long-term financial markets analysis, is available as part of a subscription to our CE Advance premium platform or to our dedicated Global Markets or Asset Allocation coverage.
We continue to expect equities to outperform most other assets through the end of next year, as the hype around AI builds and lower inflation facilitates more monetary easing in some places than investors are discounting. The tech-heavy US stock market will, in our view, remain at, or near, the front of the pack. We envisage most other “risky” and “safe” assets lagging equities during this period, but think their outright performance will still be quite healthy. Commodities are, however, a notable exception.
|
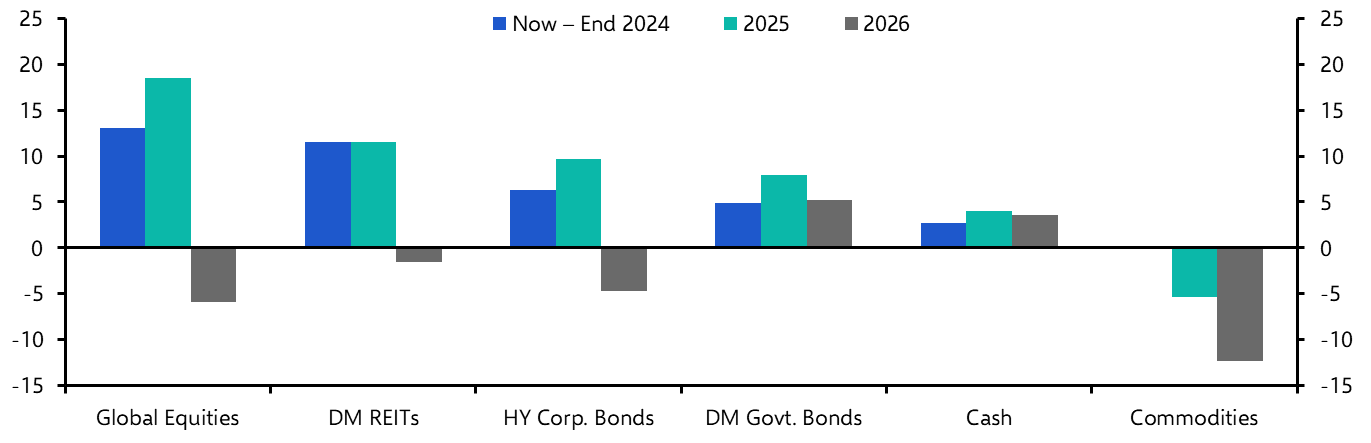
Chart 1: Projected Returns (US Dollars, %) |
|
|
|
Sources: |
Cross-Asset Outlook
We expect equities, particularly in the US, to deliver the strongest returns
- We expect “risky” assets to outperform “safe” ones over the next couple of years. We project equities to fare particularly well, as a bubble continues to inflate in the stock market. Meanwhile, bonds will, in our view, only get a small boost from looser monetary policy.
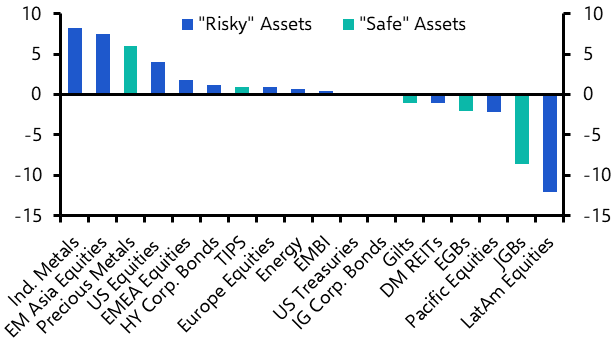
- Equities generally delivered strong returns overall in Q2 – as did industrial and precious metals. Equities in EM Asia benefitted from a recovery in China’s stock market, and those in the US were lifted by “big-tech” stocks continuing to power ahead. The main exception was Latin America: equities and currencies there generally fell. Meanwhile, Japanese government bonds struggled, as domestic yields rose and the yen depreciated against the dollar. (See Chart 2.)
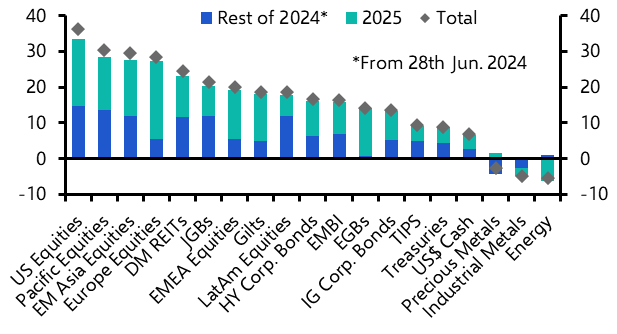
- We forecast that equities in the US will continue to fare especially well through the end of 2025. (See Chart 3.) This is because we think that a bubble will keep inflating in the meantime amid growing enthusiasm about AI, benefitting the US stock market disproportionately.
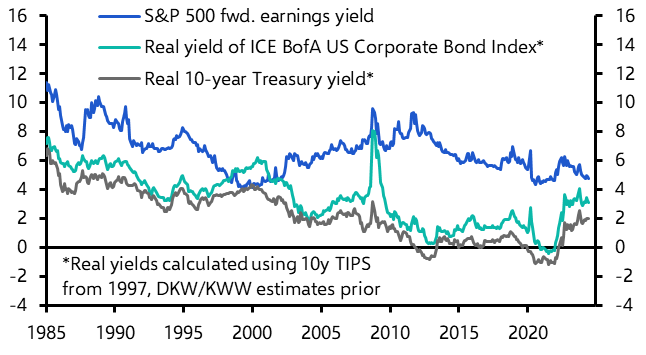
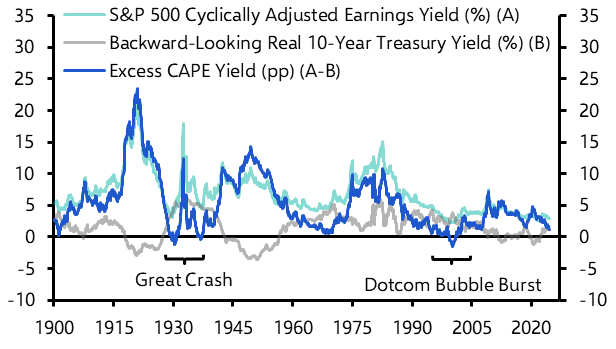
- Admittedly, equity valuations are, in aggregate, starting to look a little stretched relative to those of other assets. The gap between the forward earnings yield of the S&P 500 and the real yields of other US assets has narrowed in the past couple of years. (See Chart 4.) But we see scope for equity valuations to rise further. Indeed, the valuation gap was much smaller at the peak of the dotcom bubble (it was even negative relative to corporate bonds). Similarly, Shiller’s Excess CAPE Yield – an alternate measure of the equity risk premium – shows that valuations were more stretched at the peaks of previous bubbles than they are now. (See Chart 5.)
|
Chart 2: Returns Between 29th Mar. & 28th Jun. (US$, %) |
Chart 3: Returns Implied By CE Forecasts (US$, %) |
|
|
|
|
Chart 4: Yields Of Selected Assets (%) |
Chart 5: Shiller’s S&P 500 Excess CAPE Yield & Components (pp) |
|
|
|
|
Sources: DKW/KWW, Refinitiv, Shiller, Capital Economics. |
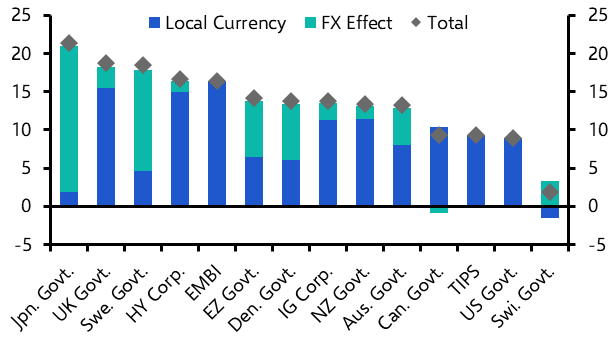
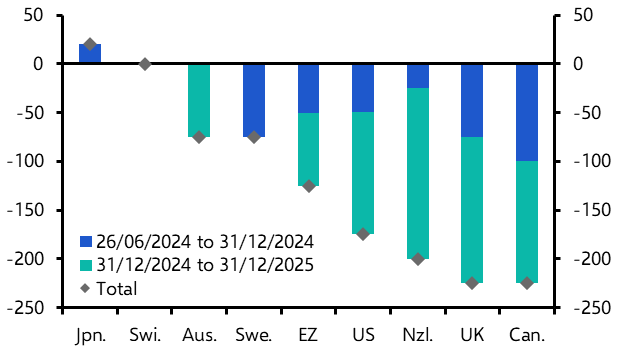
- We forecast weaker, but still robust, returns from government bonds in general. (See Chart 6.) For a start, we expect some tailwind from monetary policy; we think that most central banks around the world will loosen monetary policy in the next year or so, and generally cut a bit further than currently discounted in the markets. So we suspect that bond yields will generally end the year lower, providing some boost to bond returns – this is particularly the case in the UK. What’s more, in common-currency terms, we expect returns from government bonds in Japan, Sweden, and the euro-zone to be supported by stronger currencies there.
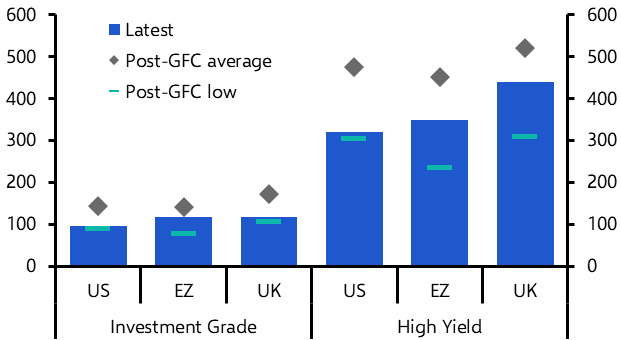
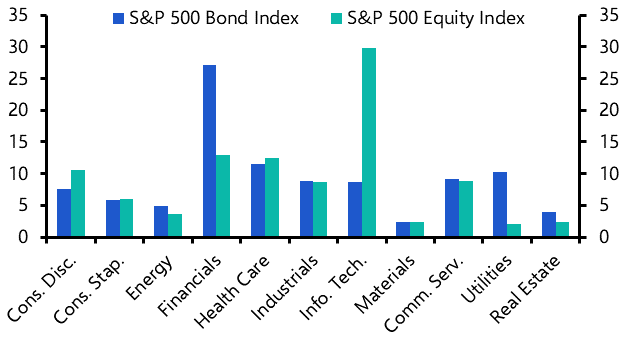
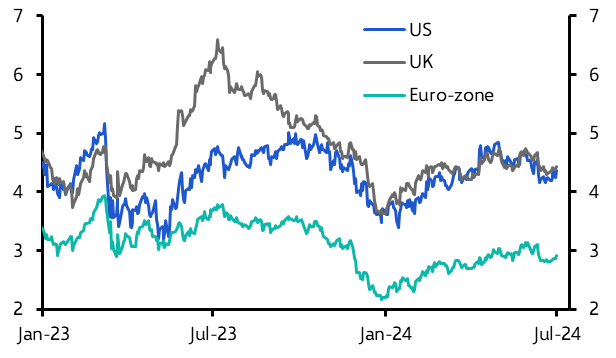
- Corporate bonds are unlikely, in our view, to keep up with equities. (See Chart 6 again.) This is because their spreads are already very narrow by past standards (see Chart 7); tech companies have much smaller weights in bond indices than in equity ones (see Chart 8); and, unlike stocks, their returns are capped in a booming market. We also doubt that risky bonds will outperform safe ones much. One reason is that spreads are also quite narrow in the case of non-US corporate bonds (see Chart 7 again) and EM sovereign dollar bonds.
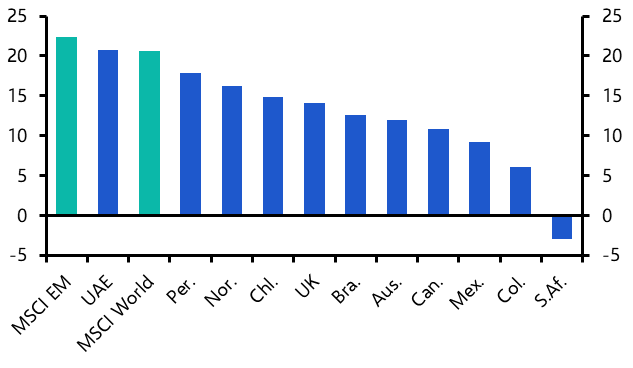
- Finally, we suspect metals’ outperformance will come to an end, and that they will, in general, deliver slightly negative returns by the end of next year. In the case of industrial metals, this is because we expect a sharp downturn in China’s construction sector to more than offset any tailwind from the “green transition”. And our view that the crude oil market will soon be in surplus feeds into our forecast that oil prices will fall back, in turn translating into poor returns from energy commodities. All this also means that we expect those stock markets highly exposed to the energy and materials sectors to underperform. (See Chart 9.)
|
Chart 6: CE Projected Bond Index Returns (28th Jun. 2024 to 31st Dec. 2025, US$, %) |
Chart 7: Option-Adjusted Spreads Of ICE BofA Corporate Bond Indices (bp) |
|
|
|
|
|
Chart 9: CE Projected Price Changes In Selected MSCI Equity Indices By End-2025 (USD, %) |
|
|
|
|
Sources: Refinitiv, Capital Economics |
- We expect easing cycles in most developed markets (DMs) – which have begun in Sweden, Canada, the euro-zone and Switzerland – to broaden out in Q3. (See Chart 10.) And we think policy will generally be eased by more than investors anticipate. The outlook in emerging markets (EMs) is more mixed in our view.
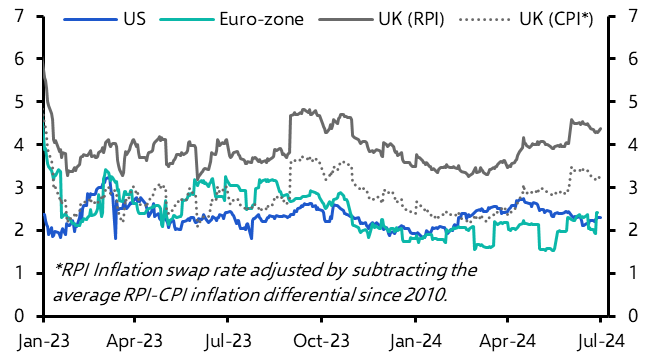
- Investors’ expectations for policy rates increased in most DMs at the start of Q2, but then fell back during the rest of the period. On net, rate expectations edged up slightly in most DMs in Q2. (See Chart 11.) That’s probably because investors’ inflation expectations ticked up over the quarter, at least in Europe. (See Chart 12). However, we continue to think that inflation will fall back to target earlier than investors expect.
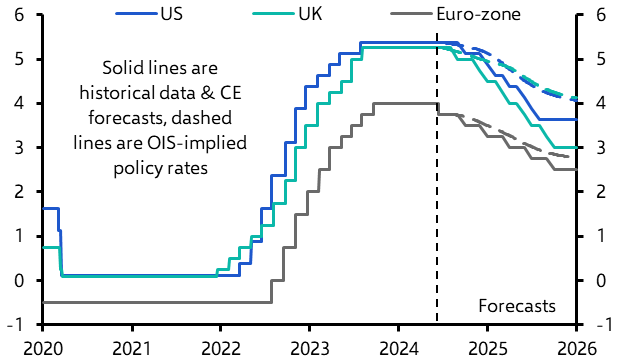
- In the US, the Fed has maintained a fairly hawkish tone amid mixed inflation and activity data, and investors’ fed funds rate expectations have stayed broadly flat throughout the quarter. For our part, we expect the Fed to begin its easing cycle in September and to cut its fed funds rate target range by a cumulative 175bp, to 3.50-3.75% by late next year. That’s about 50bp more than market pricing suggests. (See Chart 13.)
- Meanwhile, inflation has surprised to the upside in the euro-zone. So, having started its easing cycle in June, we anticipate the ECB will proceed gradually. We forecast 50bp of cuts this year and 75bp of cuts next year. That would leave the deposit rate at 2.5% by end-2025 – broadly in line with investors’ expectations. (See Chart 13.)
- In the UK, we expect the BoE to begin its easing cycle in August. Our view that CPI inflation will be weaker than most anticipate and stay below the 2% target for some time underpins our forecast that Bank Rate will be lowered to 3% by end-25. That’s roughly 100bp lower than investors now anticipate. (See Chart 13 again.)
|
Chart 10: Changes In DM Policy Rates Implied by CE Forecasts (bp) |
Chart 11: OIS-Implied Policy Rates 1-Year Ahead (%) |
|
|
|
|
Chart 12: Forward 1-Year Inflation Compensation Rates Implied By Swaps (%) |
Chart 13: US Federal Funds Rate & ECB Deposit Rate & UK Bank Rate (%) |
|
|
|
|
Sources: Refinitiv, Capital Economics |
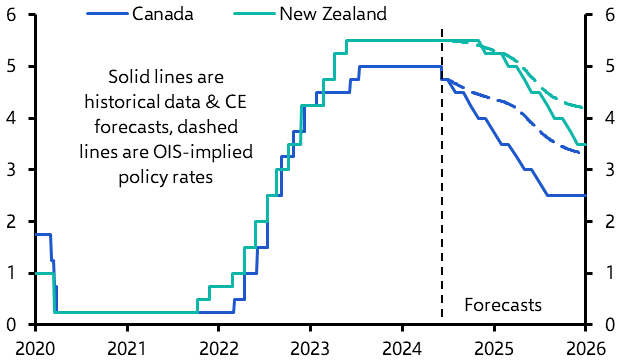
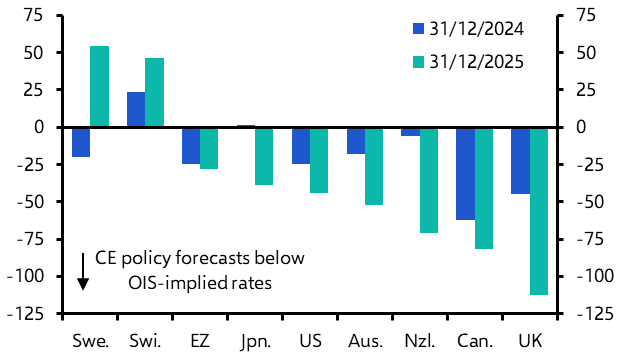
- We also expect far more rate cuts than investors do in New Zealand and Canada. We think central banks there will cut their policy rates by 175bp and 225bp by end-2025, respectively, which in both cases is roughly 75bp more than is currently discounted in money markets. (See Chart 14.) In the case of Australia, we are only a little bit closer to investors’ expectations. We think the RBA will only start easing policy in 2025, but that it will deliver a total of 75bp of rate cuts. Meanwhile, market pricing suggests that investors expect the Cash Rate to end 2025 only slightly below its current level of 4.25%.
- By contrast, we expect fewerrate cuts than investors in Switzerland and Sweden. (See Chart 15.) Indeed, we think that the SNB will keep its policy rate at 1.25% this year and next, while investors expect two additional 25bp cuts, one this year and one the next. Likewise, we think the Riksbank will lower its policy rate from the current level of 3.75% to 3% by end-2025, while market pricing implies ~50bp more of cuts.
- Bucking the trend is the Bank of Japan, which is in the process of hiking policy rates. We expect one more 20bp hike over the next year or so, less than the cumulative 60bp of tightening priced into markets over the next couple of years.
- Meanwhile, the easing cycle in EMs generally continued to broaden out in Q2. But in Latin America and CEE, where the cycle is well underway, resurfacing price pressures caused central banks to proceed more cautiously.
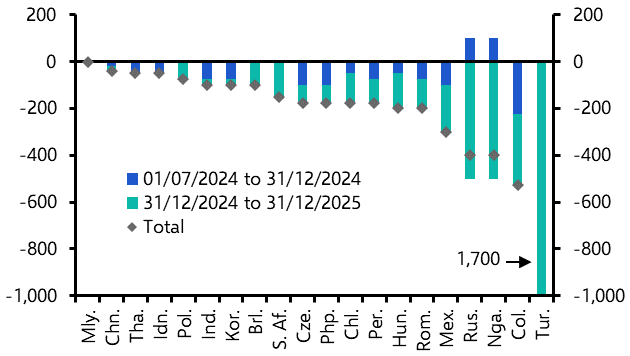
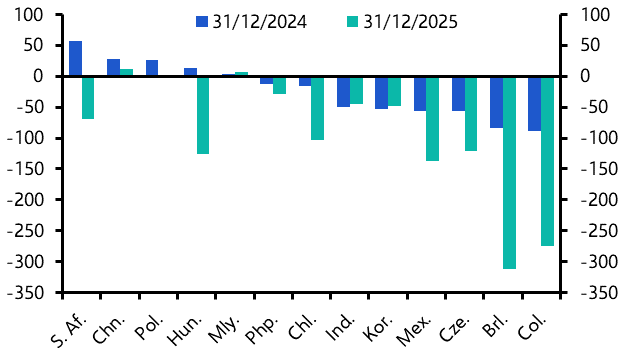
- We think central banks there will slow the pace of easing in Q3. Even so, we expect the loosening cycle in EMs to expand (see Chart 16), as we think that most central banks in Emerging Asia will start cutting rates in the rest of this year, including those in India, Indonesia and Korea. As with policymakers in DMs, we generally expect them to cut by more than investors seem to anticipate. That’s the case not only in Latin America, but also in other economies like Czechia and Korea. (See Chart 17.)
|
Chart 14: Canada & New Zealand Policy Rates (%) |
Chart 15: Difference Between CE & OIS-Implied Policy Rates (bp) |
|
|
|
|
Chart 16: Changes In EM Policy Rates Implied by CE Forecasts (bp) |
Chart 17: Difference Between CE & OIS-Implied Policy Rates (bp) |
|
|
|
|
Sources: Refinitiv, Bloomberg, Capital Economics |
Get the full report, with extensive forecasts and equities and bond market analysis including:
- Detailed equities analysis showing why we think the AI bubble could inflate further, with US stocks continuing to lead the way.
- Why we expect decent returns from DM government bonds as monetary policy is eased. Also, why we think that corporate bonds will outperform sovereign bonds by only a small amount and how EM bonds may benefit from looser monetary policy, but with limited upside.
These are just some of the key takeaways from a 23-page report published for Capital Economics clients on 1st July, 2024. The report was written by John Higgins, Hubert de Barochez, Thomas Mathews, Diana Iovanel, James Reilly and Giulia Bellicoso.

Get the full report
Trial our services to see this complete 23-page analysis, our complete global markets and asset allocation insight and forecasts and much more