
Long Run Outlook 2024:
AI productivity boom tempered by protectionist threat

The AI revolution should deliver substantial productivity gains in the coming decade, particularly in advanced economies. But with working age populations falling in key areas and China’s economy in structural decline, we expect global growth to slow compared to the past twenty years.
Below are excerpts from our latest annual Long Run Economic Outlook, a comprehensive analysis of how advanced and emerging economies will perform in the years to 2050. Access to the complete report, including extensive long-term forecasts, is available as part of a subscription to our CE Advance premium platform or to our dedicated Long Run coverage.
The fracturing of the global economy into US and China-led blocs will prompt a gradual shift in trading and financial relationships, but there is a growing threat of a more extreme and damaging lurch towards protectionism. And as the forces which previously weighed on inflation and investment incentives go into reverse, we expect equilibrium interest rates to rise.
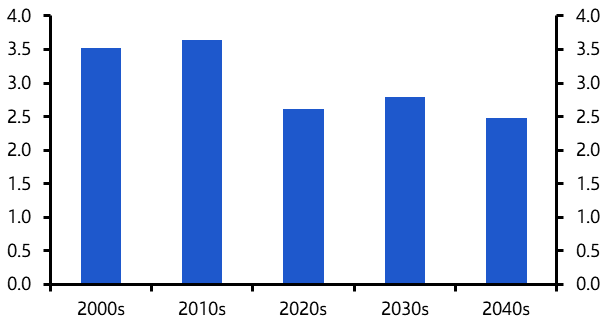
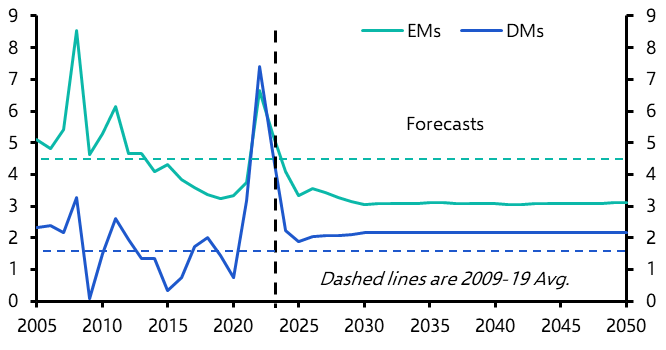
- Although advanced economies will benefit from stronger productivity growth in the coming decades, scope for catch-up growth in emerging markets will fall, and China’s trend growth will slow sharply by 2030. Accordingly, global GDP growth will average about 2.7% y/y from now until 2050, down from 3.4% y/y over the past couple of decades. (See Chart 1.)
- Demographic developments generally point to weaker global growth in the future. Admittedly, labour supply in DMs has recovered from the pandemic. (See Chart 2.) And strong net migration in countries like Canada and Australia should contribute to higher potential growth there in the decades ahead. But a decline in working age populations in several DMs, most notably Japan and Italy, will weigh on their economies’ growth prospects.
|
Chart 1: Annual Average World Real GDP (% y/y) |
Chart 2: Labour Force (% Change from Dec. 2019) |
|
|
|
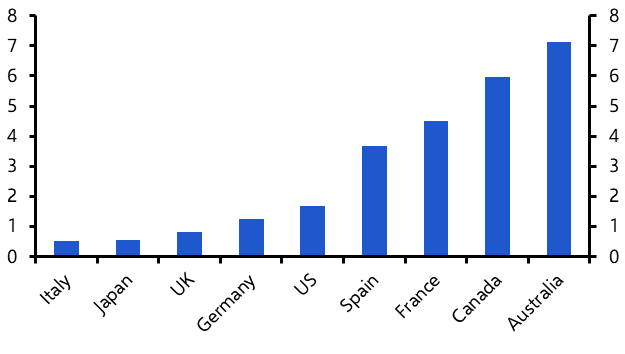
- Ageing populations will have implications for countries’ debt dynamics too. (See Chart 3.) Governments will need to shrink their primary budget deficits significantly in order to put debt ratios on a stable path after the high spending of the last few years. Fiscal risks remain particularly acute in Italy.
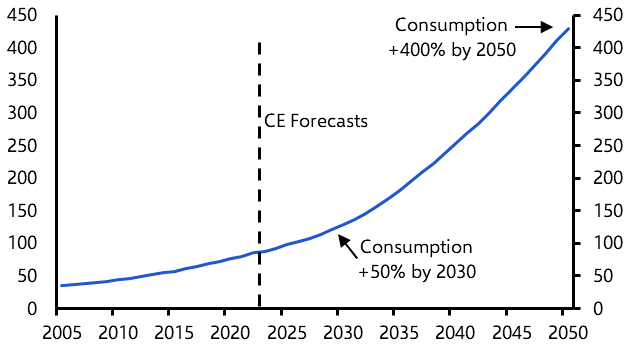
- Governments will also incur costs from the green transition. Although we don’t expect “net zero” to be reached by 2050, we think policy actions will be enough to limit the rise in global temperatures to within 2˚C. One of the major pledges arising from last year’s COP28 conference was countries’ commitments to triple renewable energy capacity by 2030. We doubt the actual rise in renewable energy demand will be as high. (See Chart 4.) But by 2050, we expect renewables to account for around 50% of global energy consumption.
|
Chart 3: OECD Estimates of Rise in Age-Related Expenditure by 2060 (As a % of Potential GDP) |
Chart 4: World Primary Renewable Energy Demand (Exajoules) |
|
|
|
- The good news is that economies will benefit from an AI-driven productivity boom in the coming decades, with the peak impacts felt in the 2030s. (See Chart 5.) Advanced economies – particularly the US – will be at the forefront of these gains. We expect DM productivity to average 2% in the 2030s, compared to less than 1% over the past two decades.
- The fact that the US and other DMs are relatively well placed to benefit from AI is one reason why the gap between EM and DM GDP growth will narrow. It also helps to explain why in a world of ongoing geopolitical fracturing, the China-led bloc’s share of world GDP won’t increase much further. (See Chart 6.) But there is a risk that global fracturing could accelerate – or take a more extreme form – if Trump were to be elected in November. After all, he has proposed a 10% universal tariff on all imports and up to 60% tariffs on Chinese imports.
|
Chart 5: Annual Average Productivity Growth (% y/y) |
Chart 6: GDP Shares of the World’s Economic Blocs |
|
|
|


- Meanwhile, the war in Ukraine has accelerated Russia’s fracturing with the US-led bloc. This will weigh on Russia’s potential growth. But other EMs such as Poland and India could benefit from a reorientation of supply chains.
- We think the era of ultra-low inflation and interest rates in DMs is behind us, as several of the structural factors which have weighed on both will go into reverse. Admittedly, we expect inflation in EMs to gradually slow to around 3% in the coming decades. But greater protectionism and more frequent climate shocks will probably cause DM inflation rates to settle at higher levels than during the decade following the GFC and before the pandemic. (See Chart 7.)
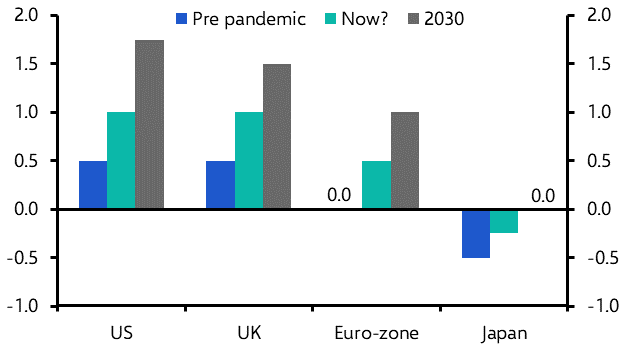
- At the same time, AI will boost potential growth, while desired investment relative to savings should rise as the green transition continues, more people enter retirement and government borrowing remains elevated. Accordingly, we estimate that equilibrium real interest rates, or r*, will rise (see Chart 8), causing nominal policy rates to settle at higher levels than pre-pandemic.
|
Chart 7: CPI Inflation (%) |
Chart 8: CE Estimate of Equilibrium Real Interest Rate (%) |
|
|
|
- In 2050, the US will still be the world’s largest economy, while China will have barely gained any ground. Poor demographics mean the euro-zone’s share of world GDP will have fallen, while several emerging Asian and African economies – most notably India – will experience some of the fastest growth.
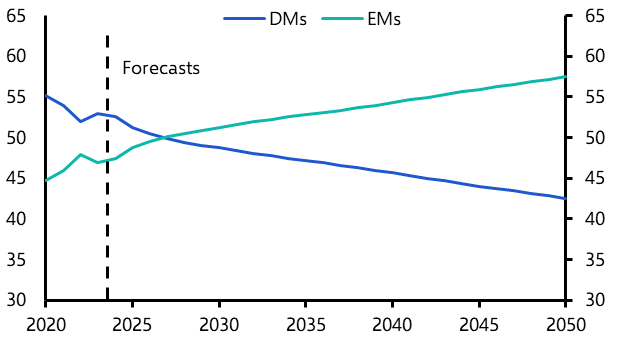
- We expect real world GDP growth to average 2.7% y/y in the coming decades, meaning that by 2050 the global economy will be just over double its current size. And although growth will slow in emerging markets, it will continue to outpace that in advanced economies. By 2050, EMs will account for 57% of global GDP at market exchange rates, up from 47% currently. (See Chart 9.)
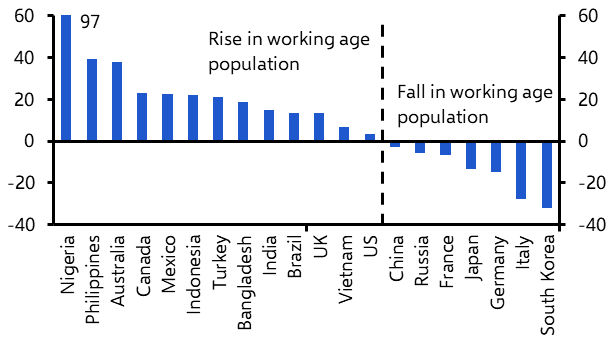
- Working age populations will have fallen significantly in several advanced economies. (See Chart 10.) This helps to explain why by 2050, Germany will have fallen from the 3rd largest economy in the world to the 5th, while Italy will have dropped out of the top 10. Poor demographics will also reduce growth rates in the original Asian Tiger economies, causing them to slide down the rankings of the world’s largest economies.
|
Chart 9: DM vs EM Share of World GDP (%, Nominal, Based on Market Exchange Rates) |
Chart 10: Change in Working-Age Population |
|
|
|
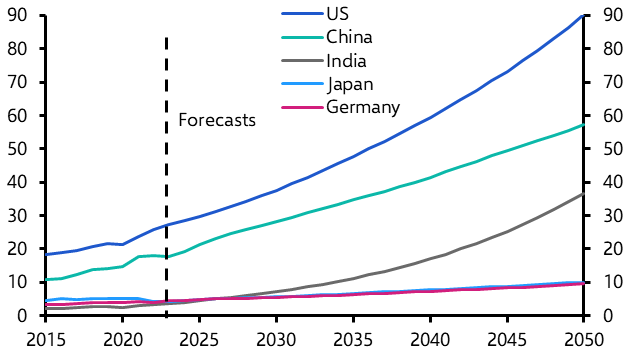
- But we are more upbeat about the outlook for other emerging Asian economies. India will replace China as home to the world’s largest labour force. And a shift towards manufacturing should enable the economy to grow by more than 5% on average, and experience some of the strongest GDP per capita growth. India’s economy will soon rise from the 5th to the 3rd largest globally. And by 2050, it will be more than triple the size of Japan’s. (See Chart 11.)
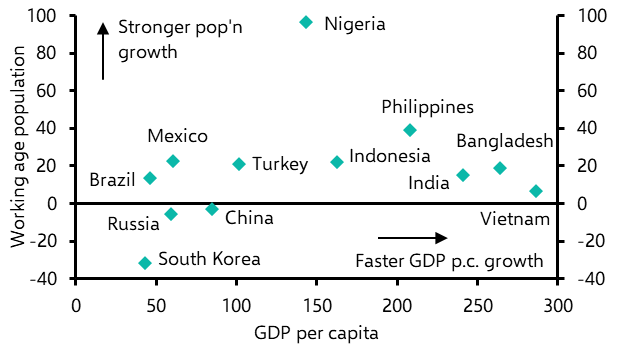
- Meanwhile, several South East Asian economies will see strong growth in working age populations, while shifts in their labour forces to higher productivity sectors should drive strong GDP per capita growth. (See Chart 12.) Vietnam, Bangladesh and the Philippines will enter the top 20 largest economies, while Indonesia will break into the top 10.
|
Chart 11: Nominal GDP ($ tn, Based on Market Exchange Rates) |
Chart 12: % Change in GDP Per Capita & Working Age Population (2023-2050) |
|
|
|
- Countries in Sub-Saharan Africa will also experience some of the strongest population and hence GDP growth. By 2050, Nigeria will have climbed 15 places to 20th in the global rankings. But structural factors such as weak institutions and a low capital stock mean that growth in GDP per capita across the region will be slower. And African countries are among the most vulnerable to climate change.
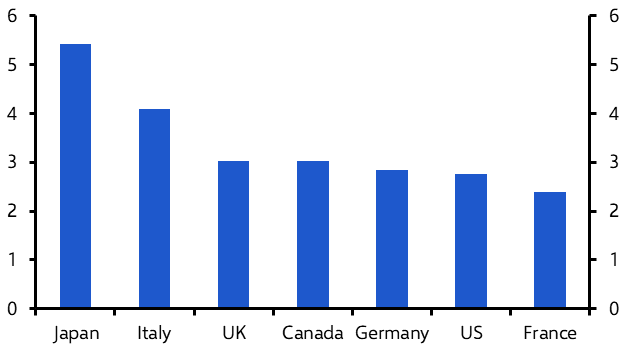
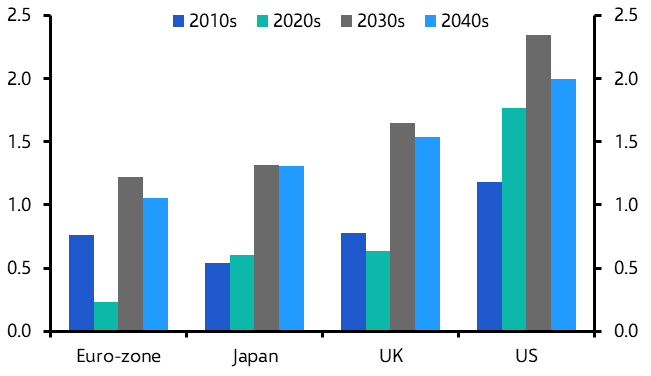
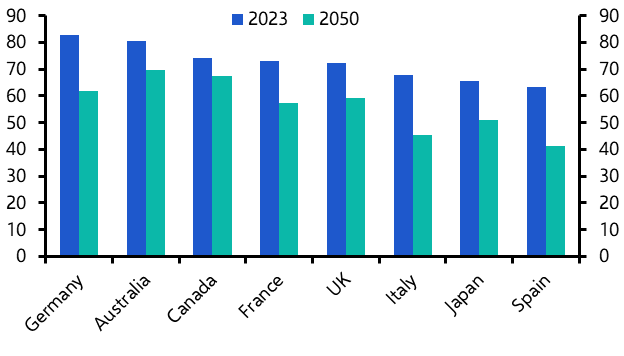
- We expect the US to remain the world’s biggest economy. And although other DMs like the UK will also experience strong productivity growth, it will fall short of that in the US. (See Chart 13.) Accordingly, GDP per capita relative to the US will actually fall in major DMs. (See Chart 14.)
|
Chart 13: Annual Average Productivity Growth (%) |
Chart 14: Real GDP per Capita (% of US, at Constant 2022 PPP Exchange Rates) |
|
|
|
- By 2050, the world will have coalesced into US and China-led blocs, thereby reducing technology and investment flows between the two blocs. This will weigh on productivity more in the China-led bloc, meaning that China won’t have surpassed the US as the world’s largest economy. In fact, the size of China’s economy relative to the US will barely change.
- We expect most governments in advanced economies to take action to reduce budget deficits over the coming decades. But even so, we expect debt to GDP ratios in many cases to still exceed 100% by 2050. (See Chart 15.)
- Even after the persistent inflation overshoots of the past couple years, we think central banks will continue to target inflation. Our forecasts that equilibrium interest rates will rise mean that nominal policy rates in DMs will settle at higher levels. (See Chart 16.) Policy rates will be highest in the US, at around 3.5%. We even think Japan’s policy rate will finally exit negative territory, reaching 2% by the 2030s.
|
Chart 15: Government Debt as a % of GDP |
Chart 16: Nominal Policy Rates (%, Annual Average) |
|
|
|
|
|
Sources: Refinitiv, UN, OECD, Capital Economics |


This content is based on an original report published on 20th February, 2024 and written by Senior Global Economist Ariane Curtis and the Global Economics team.
Get the full report
Trial our services to see this complete analysis, our complete long-run insight and forecasts and much more