
The labour market is cracking
Q3 2025 UK Economic Outlook

The falls in employment triggered by the Chancellor’s rises in National Insurance Contributions for employers and the minimum wage have increased our confidence that it is only a matter of time before wage growth and CPI inflation slow to rates consistent with the 2.0% inflation target.
This is a sample of our latest quarterly UK Economic Outlook, originally published on 7th July, 2025. Some of the forecasts contained within may have been changed since publication. Access to the complete report, including extensive forecasts and near to long-term analysis, is available as part of a subscription to our subscription services.
The weakening in the labour market triggered by the rises in taxes for businesses has raised our confidence in our forecast that inflation will fall further than most expect. As a result, we now think the Bank of England will cut interest rates from 4.25% to 3.00% instead of to 3.50%.
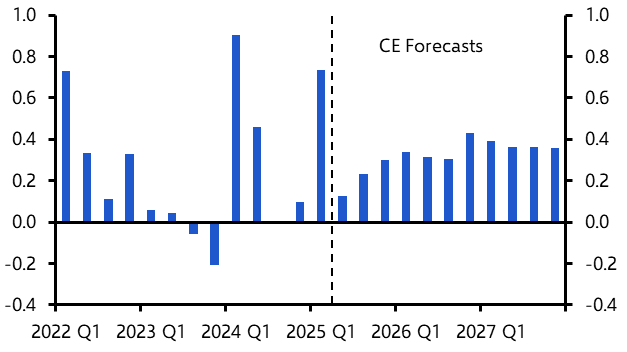
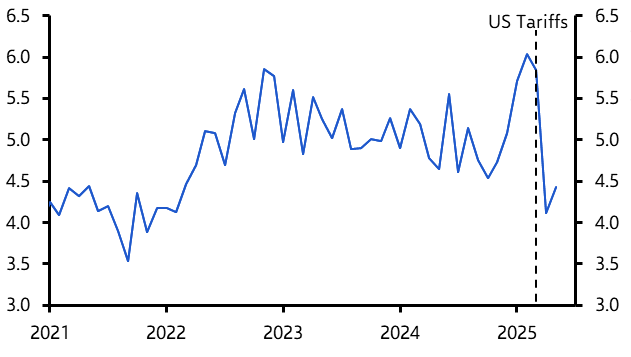
- Just as the 0.7% q/q leap in GDP in Q1 wasn’t a sign that the economy is fundamentally stronger, our forecast of a 0.1% q/q rise in Q2 isn’t a sign that the underlying pace of GDP growth is that weak. (See Chart 1.) Instead, the prospect of US tariffs being imposed on UK exports from April meant that some exports to the US happened in Q1 instead of in Q2. (See Chart 2.)
|
Chart 1: Real GDP (%q/q) |
Chart 2: UK Goods Exports to the US (Values, £bn) |
|
|
|
- More generally, the 10% tariff on most UK exports to the US won’t meaningfully reduce UK GDP (see here), although softer overseas demand means that net trade will be a drag on growth both this year and next.
- Instead, the key reason why we expect GDP to rise by just 1.2% this year and next is because of the drag from the rises in National Insurance Contributions for employers (NICs) and the minimum wage announced in last October’s Budget and implemented at the start of April, both of which raised businesses’ labour costs.
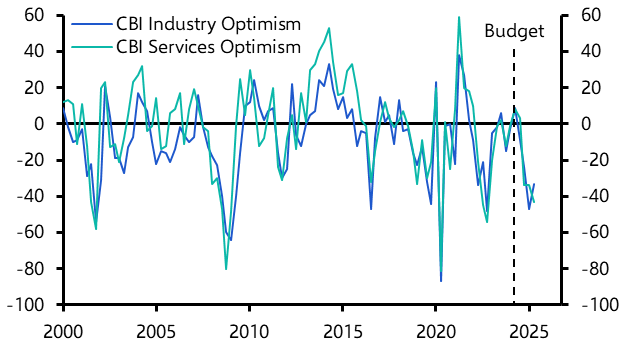
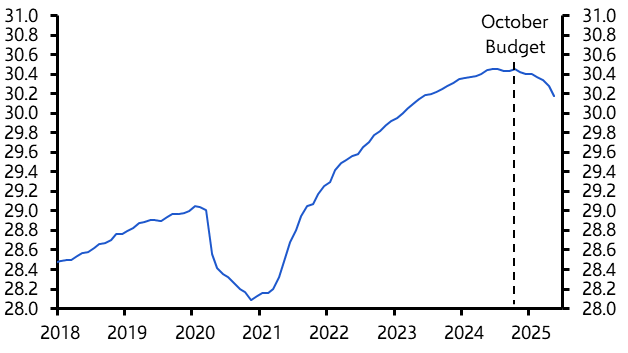
- Business confidence has yet to reverse its initial plunge and we expect business investment to be subdued for the rest of this year as a result. (See Chart 3.) And the 275,000 (0.9%) fall in payroll employment since the Budget shows that firms have cut their hiring plans in order to contain their labour costs. (See Chart 4.)
|
Chart 3: CBI Business Confidence (Balance) |
Chart 4: PAYE Payroll Employment (Millions) |
|
|
|
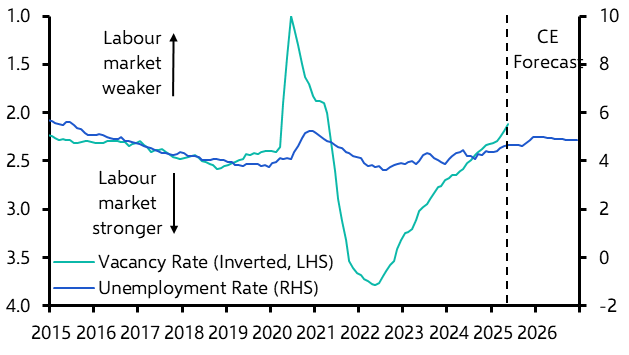
- The unemployment rate has risen from 4.1% late last year to 4.6% in April and we forecast a rise to 5.0% in the coming quarters. In fact, the fall in the job vacancy rate implies the labour market is looser than the unemployment rate suggests. (See Chart 5.)
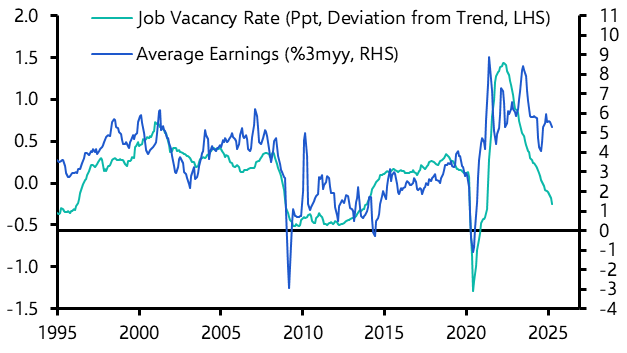
- This suggests it is only a matter of time before wage growth slows from the recent rates of 5.5% to the rate of 3.5% more consistent with the 2.0% inflation target. (See here and Chart 6.)
|
Chart 5: Unemployment Rate & Job Vacancy Rate (%) |
Chart 6: Average Earnings & Job Vacancy Rate |
|
|
|
- Admittedly, CPI inflation will probably stay close to May’s 3.4% in the coming months before rising to 3.7% in September. And it is probably too soon to conclude that the upside risks to inflation from events in the Middle East have completely faded. (See here.)
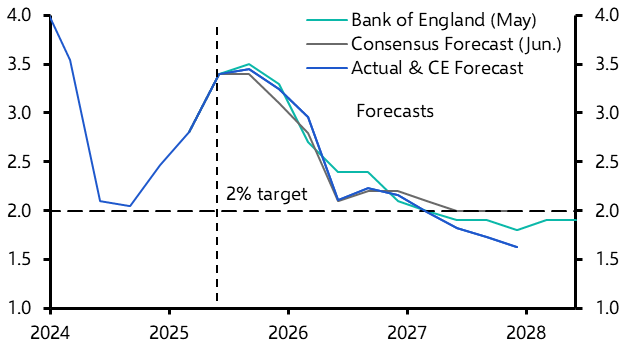
- But we’ve become more confident in our forecast that the easing in wage growth will contribute to CPI inflation falling to 2.0% in late 2026 and below 2.0% in 2027. That would leave CPI inflation lower than other forecasters and the Bank of England expect. (See Chart 7.)
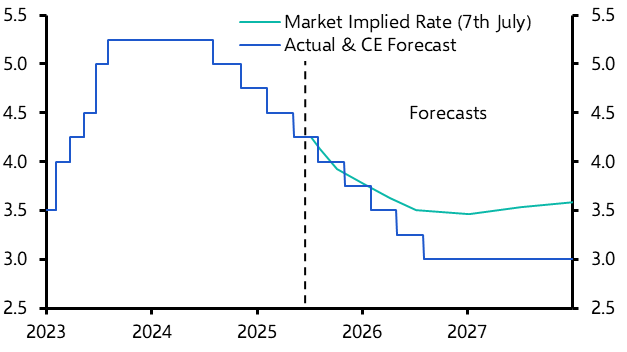
- That’s why we think the Bank will continue to cut interest rates by 25 basis points (bps) a quarter from 4.25% now until they reach 3.00% in 2026. That implies there is scope for market rate expectations to fall further. (See Chart 8.)
|
Chart 7: CPI Inflation (%) |
Chart 8: Bank Rate (%) |
|
|
|
|
|
Sources: LSEG Data & Analytics, ONS, BoE, Capital Economics |
- Even so, if the Chancellor is going to continue to meet her fiscal rules with a buffer of £9.9bn, she’ll probably have to raise up to £24bn in the Budget this autumn. (See here.) We suspect that will mean taxes rise further. That would be an extra headwind for the economy and one more reason why interest rates may need to be reduced to 3.00%.
- Beneath our forecast that overall GDP growth will be subdued at 1.2% both this year and next year are two different trends; public sector activity will be stronger than private sector activity and consumer activity will be stronger than business activity.
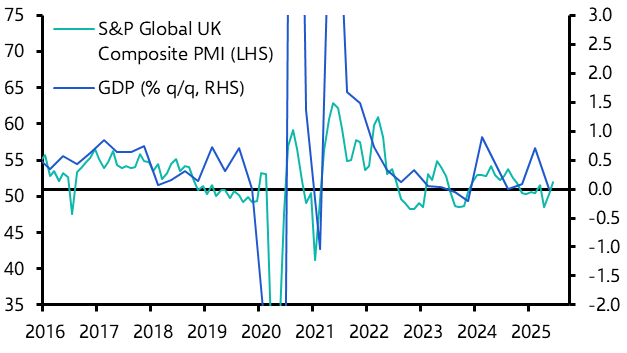
- The latest activity PMI suggests that, absent of the swings in GDP caused by the recent shifts in the timing of net exports and business investment, the underlying quarterly rate of economic growth is currently just above 0.0%. (See Chart 9.) That should improve rather than weaken in the second half of the year.
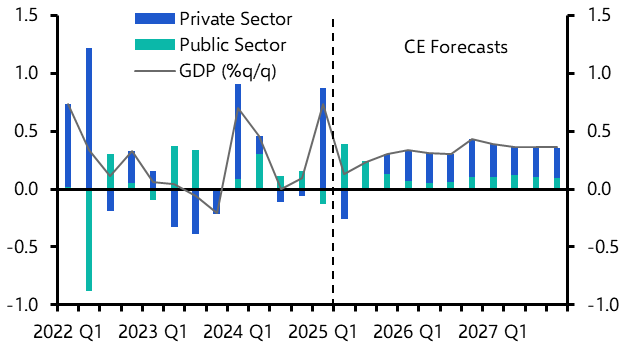
- Indeed, the rises in government spending and public investment announced in last October’s Budget should result in public sector activity making a bigger direct contribution to GDP growth in the coming quarters. This is just as well as private sector activity may soon be a drag on GDP growth again. (See Chart 10.)
|
Chart 9: Activity PMI & Real GDP |
Chart 10: Contributions to %q/q Real GDP (ppts) |
|
|
|
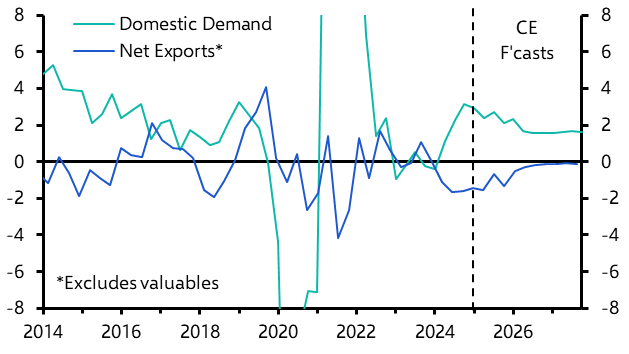
- Within private sector activity, we are particularly downbeat on the outlook for businesses for two reasons. First, while the 10% tariff on the UK’s exports to the US that began in April is unlikely to significantly influence overall UK exports (aside from pulling some exports to the US into Q1 from Q2), the downward revisions to our world GDP growth forecasts (see here) mean that net exports will be a bigger drag on UK GDP growth than we previously thought. (See Chart 11.)
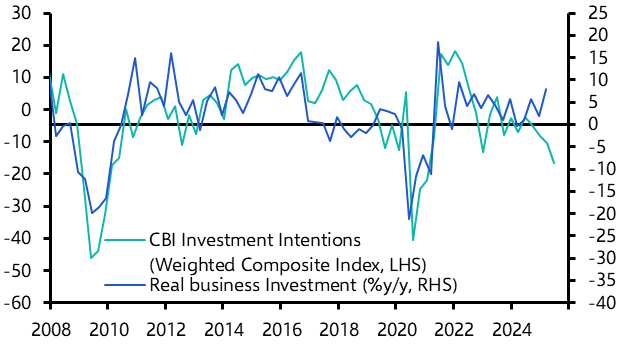
- Second, the full drag on private investment, and particularly business investment, from the rises in NICs and the minimum wage in April has yet to be felt. (See Chart 12.) Residential investment is unlikely to add much to GDP growth either as there aren’t many signs that the government will get near its target of building 1.5 million new homes by 2029. (See here.)
|
Chart 11: Contributions to %y/y Real GDP (ppts) |
Chart 12: Business Investment Intentions & Actual Business Investment |
|
|
|
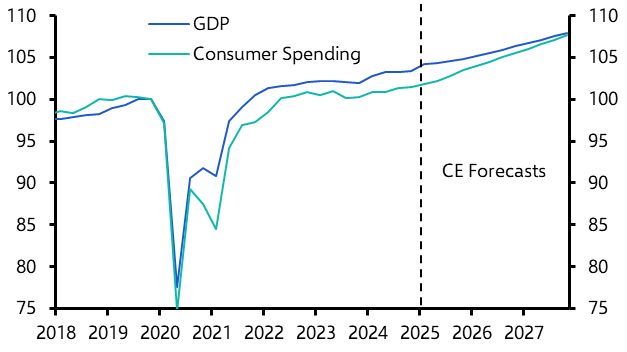
- But we think there is scope for consumer spending to outperform business activity and the wider economy. Indeed, our forecast envisages consumer spending finally closing the gap with overall GDP opened up by the pandemic. (See Chart 13.)
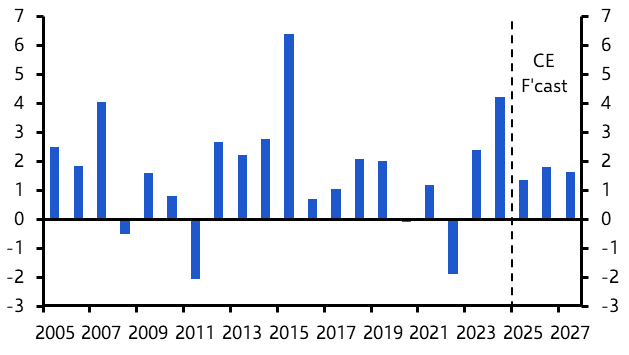
- Admittedly, the combination of the recent rebound in inflation and the softer outlook for both employment and wage growth means that real household disposable income growth will slow, perhaps from 4.2% last year to about 1.5% this year and to 1.9% next year. (See Chart 14.)
|
Chart 13: Real GDP & Real Consumer Spending (Q4 2019 = 100) |
Chart 14: Real Household Disposable Income (%y/y) |
|
|
|
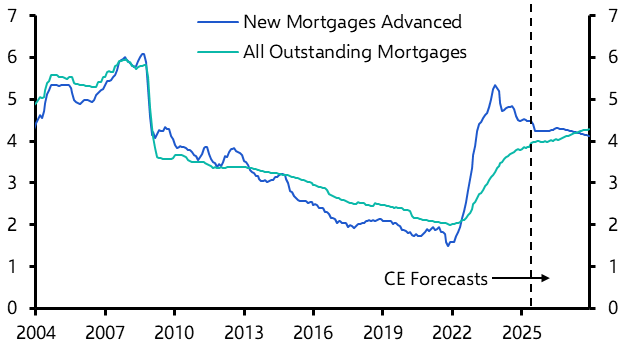
- And households won’t significantly benefit for a while from the cuts in Bank Rate from 5.25% to 4.25% that have already happened and the cuts to 3.00% to come. The high share of fixed rate mortgages means that the mortgage rate paid on all outstanding mortgages will edge higher for a while yet. (See Chart 15.)
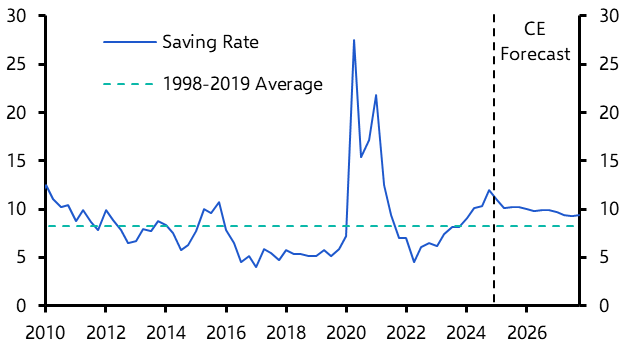
- Instead, our forecast that consumer spending growth will accelerate from 0.6% last year to around 1.4% this year and to 2.1% in 2026 is based on our view that households will lower their saving rate. This would usually happen when interest rate cuts are reducing the incentive to save. And with the saving rate in Q1 unusually high at 10.9%, there is plenty of scope for it to fall. (See Chart 16.)
|
Chart 15: Mortgage Rates (%) |
Chart 16: Household Saving Rate (As a % of Income) |
|
|
|
|
|
Sources: LSEG Data & Analytics, S&P Global, Capital Economics |
- That said, there is a risk that consumer spending doesn’t live up to our forecasts. The weakening in employment growth could prompt households to keep their saving rate higher. Or if taxes are raised again in the Budget in the autumn, real household disposable income growth could slow further.
Capital Economics clients get the full analysis, including:
- Why we think it's only a matter of time before wage growth falls to 3.0%.
- How, although upside risks linger, inflation will eventually fall below 2.0%.
- Detailed analysis showing why monetary policy will be looser than the consensus expectation, but fiscal policy will be tighter.
This is a sample of the 13-page UK Economic Outlook prepared for Capital Economics clients, published on 7th July 2025 and written by Paul Dales, Ruth Gregory, Ashley Webb and Alex Kerr.

Get the full report
Trial our services to see this complete 13-page analysis, our complete UK macro insight and forecasts and much more