
Prices to bottom out, but activity will remain soft
UK Housing Market Outlook Q1 2024

The peak-to-trough fall in nominal and real house prices that we forecast is smaller than previous corrections. The difference can be explained by less stretched affordability than in the late 1980s, and more benign credit and labour market conditions than after the financial crisis.
This is a sample of our 12-page Q1 2024 UK Housing Market Outlook, originally published on 21st November, 2023. Some of the forecasts contained within may have been changed since publication. Access to the complete report, including detailed forecasts and near to long-term analysis, is available as part of a subscription to our CE Advance premium platform or to our dedicated UK Housing Market coverage.
Surprisingly resilient demand, high inflation, and limited supply mean a severe drop in house prices will be avoided. With the peak in mortgage rates now behind us and the labour market in good shape, there is no clear trigger for another significant leg down in prices. Our central forecast is that prices fall by just 1.5% in 2024. That said, high mortgage costs will mean mortgaged demand remains very weak, suppressing overall transactions and causing a deep contraction in housebuilding. Things should improve in 2025, after the first cut in Bank Rate next autumn facilitates larger falls in mortgage rates, improving affordability to the extent needed for demand to recover.
The Mortgage Market and Affordability
Stretched affordability to suppress lending
- We think that mortgage rates will ease from their current 5.2% to just under 5.0% for most of 2024 before cuts to Bank Rate cause a further fall to 3.5% by end-2025. This will leave affordability very stretched in 2024, meaning that the cost of a new mortgage will continue to prevent many from buying. As a result, mortgage lending is set to remain weak in 2024 before a further drop in mortgage rates facilitates a recovery in 2025.
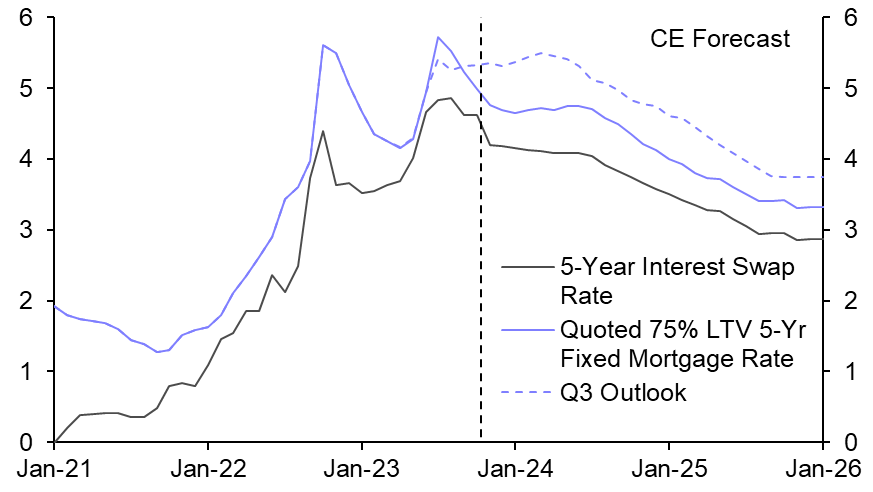
- We have revised down our near-term mortgage rate forecast from 5.5-6.0% to just under 5% until Q3 2024. (See Chart 1.) After the recent peak in mortgage rates, they have dropped faster than we anticipated due to falls in both market interest expectations and lenders’ interest margin (the gap between mortgage rates and market rates).
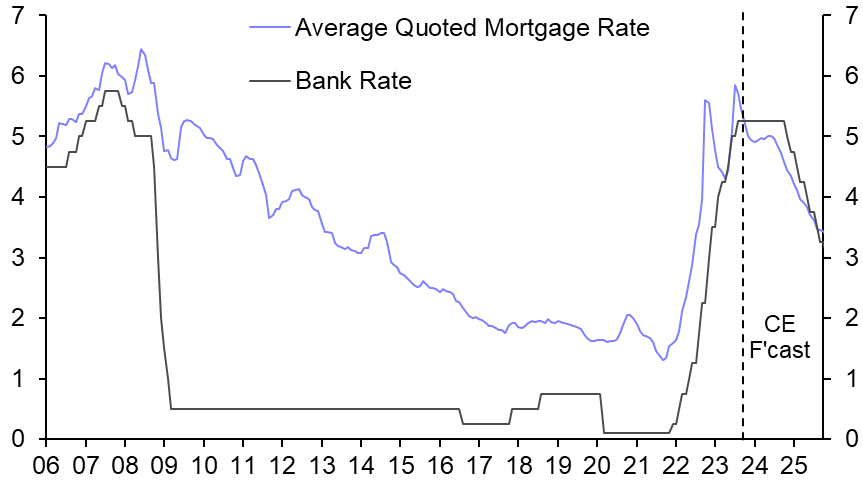
- If we are right to think that Bank Rate will be kept at 5.25% until November 2024, interest swap rates shouldn’t fall further. Meanwhile, a modest rise in the unemployment rate from 4.2% to 4.8% by Q2 2024 will put upward pressure on interest margins, as lenders increase profit margins on new loans to offset losses on their existing book. Together, that should keep mortgage rates flat for the next nine months. Cuts to Bank Rate from next autumn will lead to a material drop in mortgage rates thereafter, to 4.6% by end-2024 and 3.5% at end-2025. (See Chart 2.)
|
Chart 1: 5-Year Interest Swap Rate & Mortgage Rate (%) |
Chart 2: Mortgage & Bank Rate (%) |
|
|
|
Completed Sales, Valuations, and House Prices
House prices close to bottoming out
- While mortgaged demand will remain weak in 2024, strong demand from cash buyers will cushion the fall in overall transactions. Without a trigger for supply conditions to loosen and with demand set to pick up from late 2024, we suspect house prices will only record a slight further drop before stabilising.
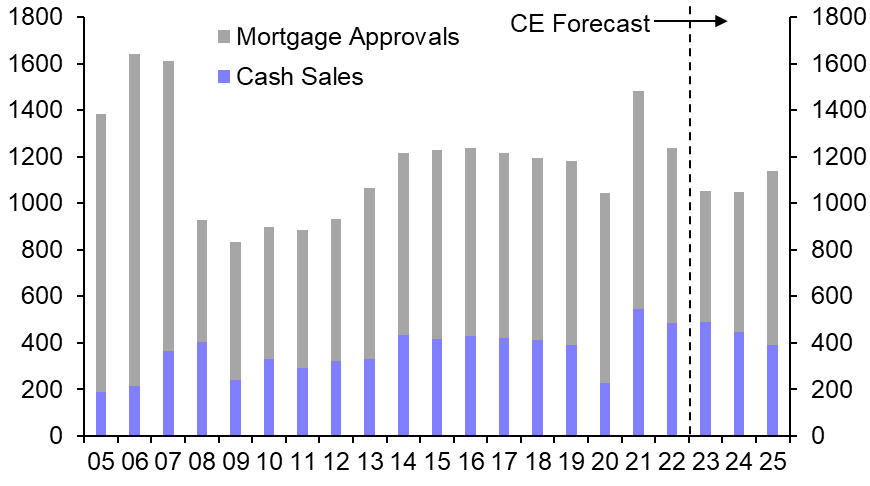
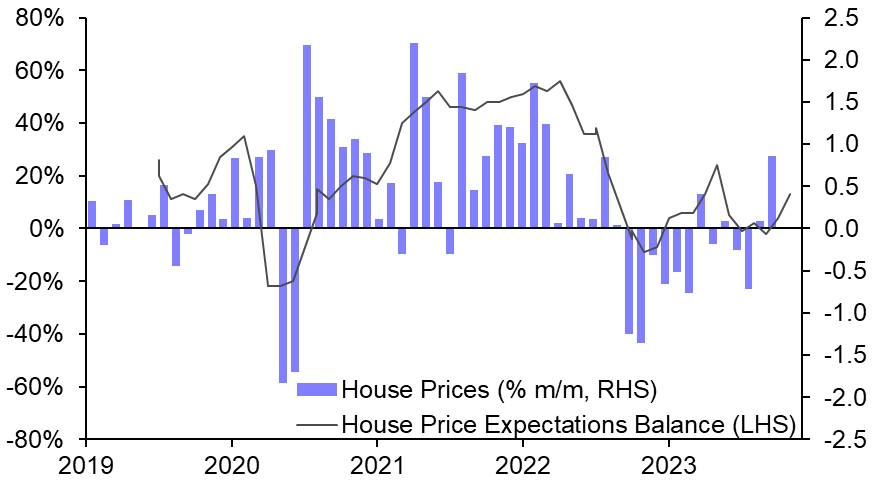
- Strong demand from cash buyers is likely to continue to partly offset the drop in demand from those that need a mortgage. Our estimates show the number of cash purchases reached a record high in 2022, 34% above pre-pandemic levels. (See Chart 3.) While we expect cash sales to ease back, house price expectations have turned positive again which argues against these buyers suddenly withdrawing from the market. (See Chart 4.)
- So, while we expect mortgage approvals to be 25% below pre-pandemic levels in 2024, transactions are only likely to be 11% down at just over 1.0m, the same as in 2023. Stronger mortgage demand should allow transactions to recover closer to pre-pandemic levels of 1.2m in 2025. (See Chart 3 again.)
|
Chart 3: Housing Transactions |
Chart 4: Public House Price Expectations & House Prices |
|
|
|
The Regional Outlook
London’s resilience coming to an end
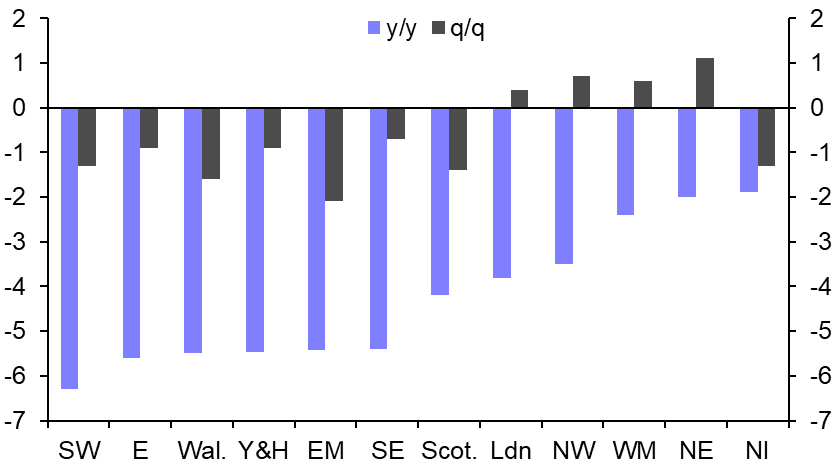
- Our view that mortgage rates will stay high until autumn next year suggests that house price falls will remain concentrated in the south, where mortgage affordability is most stretched. Given London looks worst on affordability and the surveys are softest there, it is likely to see the largest drop in prices from here. At the other end of the spectrum, house price falls in Northern Ireland and the North are likely already behind us.
- The largest falls in house prices to date have generally happened where affordability is most stretched and we think that pattern will continue. In the worst-hit markets, prices have fallen by 5-6% whereas they have fallen by just 2-3% in regions where affordability is not as problematic. (See Chart 5.)
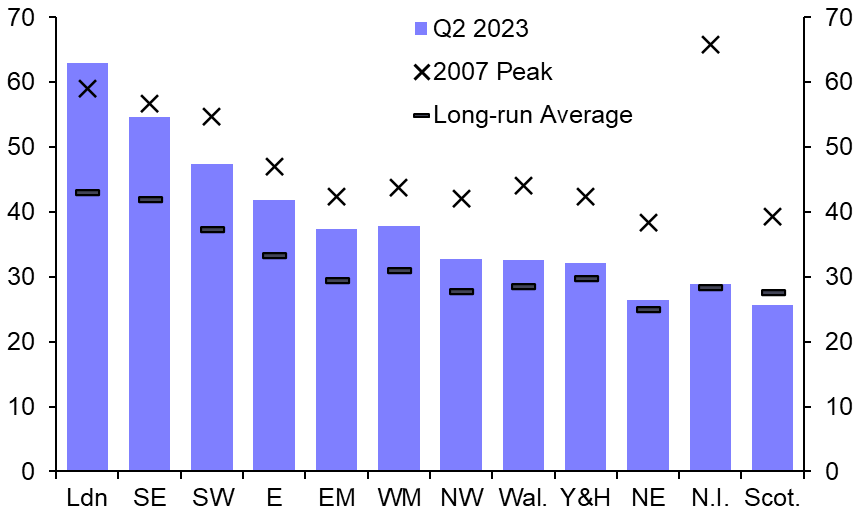
- Wales and Yorkshire & The Humber (Y&H) have seen relatively large falls in prices given affordability there isn’t particularly bad, so we doubt those declines will continue. Meanwhile, despite recording some of the largest price falls thus far, affordability in the South East, South West and East remains much worse than its long-run average, which will continue to weigh on demand in those regions. (See Chart 6.)
|
Chart 5: Nationwide Regional House Price Indices |
Chart 6: Typical Mortgage Payments as a Share of Local Median Disposable Income (%) |
|
|
|
Residential Lettings Market
Rapid increase baked in, but stretched affordability will soon bite
- The official measure of private rents has some catching up to do to match the jump in market rents. Therefore, we think the official measure of rental growth will rise to new record highs. But there are signs that rental affordability is beginning to bite, which will cause growth in market rents to moderate over the next year.
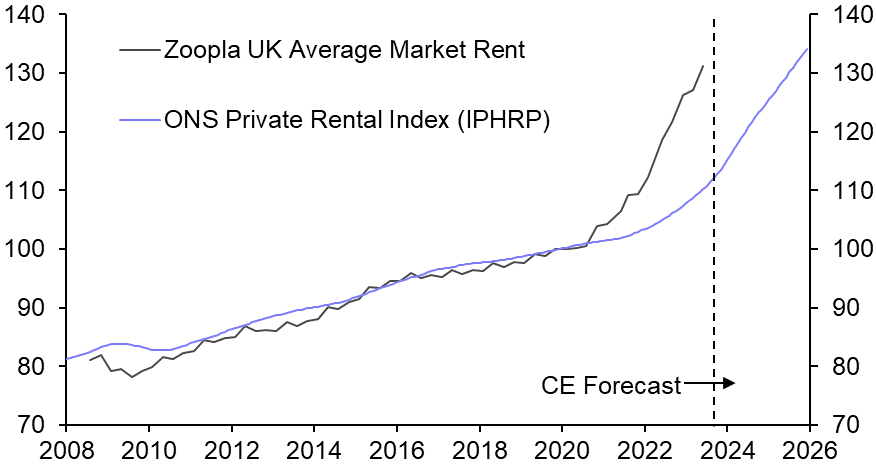
- A further acceleration in the ONS’s measure of private rents is already baked in. The ONS measure covers the price of all outstanding rents, as opposed to just new lets. It has only increased by 13% since the end of 2019 while market rents are up by 32%. That reflects the price on existing tenancies, which typically last around three years, rising much more slowly than market rents if at all.
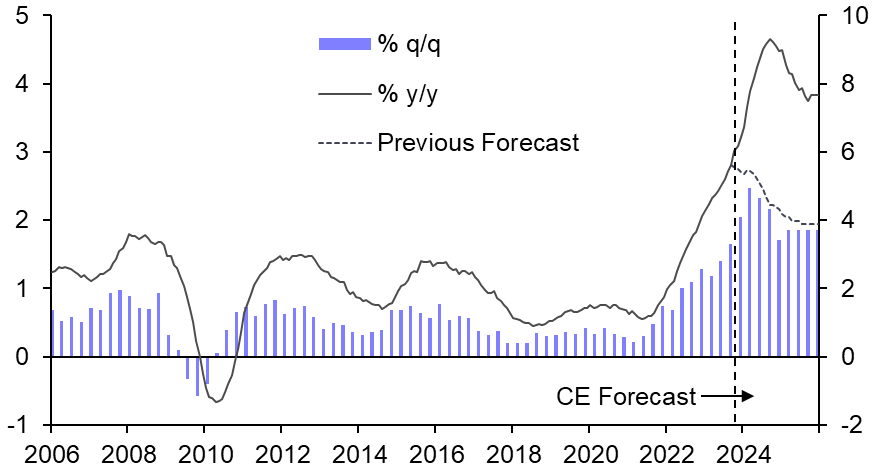
- The two measures increased by about the same amount in the decade up to 2019 and we don’t see any reason for a permanent divergence now. (See Chart 7.) As a result, we have revised up our forecast for rental growth from 4% y/y in 2024 and 2025 to 9% and 8% respectively. (See Chart 8.)
|
Chart 7: Official & Zoopla Measures of Private Rents |
Chart 8: Index of Private Housing Rent Prices |
|
|
|
Housing Supply
Construction to slump to eleven-year low
- A temporary jump in housing starts in Q2 will give way to the lowest levels of housing construction for a decade, as builders delay completions to avoid flooding the market while demand is weak and sales slow. It is likely to be 2025 before new build volumes return to normal levels.
- The spike in housing starts in Q2 has already given way to extremely weak construction activity. Housing starts in England spiked to their highest level on record in Q2 as builders began work early to avoid having to conform with the Future Homes Standard. Indeed, completions were unmoved. (See Chart 9.)
- More timely monthly data show that starts slumped in July and were around two thirds lower than volumes the year before through to October. (See Chart 10.) We suspect that starts will be very weak in the second half of 2023. So, notwithstanding the spike in Q2, starts in 2023 as a whole are likely to fall by around a quarter year-on-year from 176,000 to 142,000.
|
Chart 9: Starts & Completions (000s) |
Chart 10: Plot Starts (000s) |
|
|
|
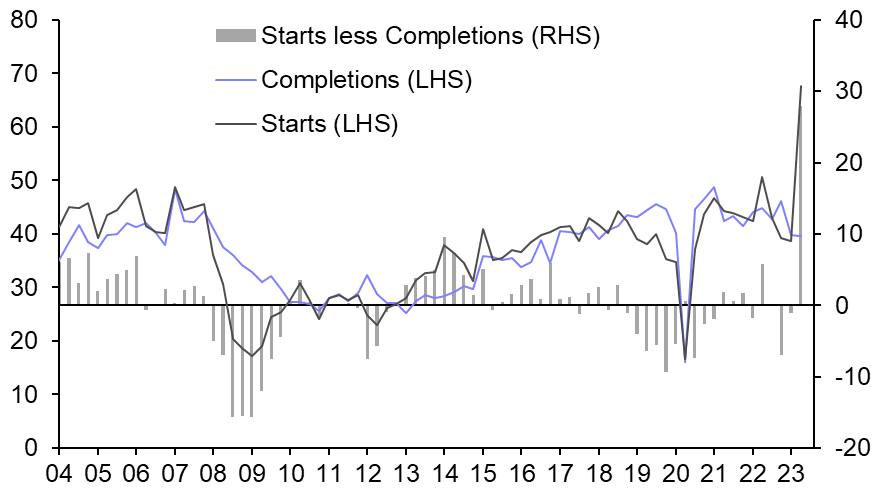
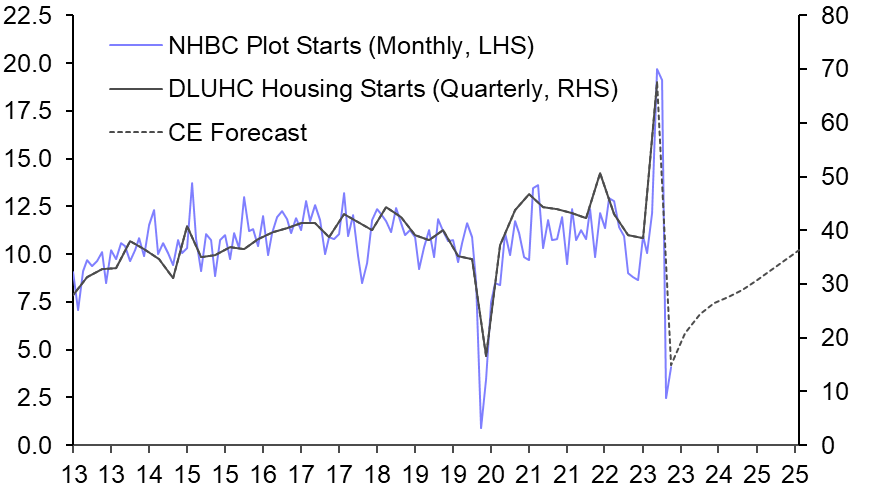
Chart sources: Capital Economics, Refinitiv, Bank of England, YouGov, Nationwide, ONS, Zoopla

Get the full report
Trial our services to see this complete 12-page analysis, our complete UK housing market insight and forecasts and much more
This is an abridged version of a 12-page Outlook report prepared for Capital Economics clients by Andrew Wishart and Imogen Pattison and published on 21st November, 2023.