The Weekly Briefing:
What's really been behind the US stock market rally?
A Capital Economics podcast
2nd June, 2023
US stocks ended the week with a broad rally in the wake of the May jobs report, but the S&P 500’s performance this year has been mostly dictated by the outsized strength of just a handful of giant tech firms. Oliver Allen and Adam Hoyes from our Financial Markets team talk to David Wilder about what’s really been happening under the hood of the US stock market, how this has played before and what it means for the outlook for equities.
Plus, from that jobs report to euro-zone inflation to the latest PMIs, Simon Macadam from our Global Economics team reviews the week’s data to discuss how they’ve affected the global growth-inflation-policy outlook – including why we still think recessions in advanced economies are on the cards.
Analysis referenced in this episode:
Transcript
David Wilder
It's Friday, 2nd June and this is your Capital Economics Weekly Briefing. I'm David Wilder. Coming up, we'll be finding out why the US stock market rally this year isn't all that it seems. But first, Neil's out, but I'm happy to say that Simon MacAdam is joining us from our Global team. Hi, Simon.
Simon MacAdam
Hi, David.
David Wilder
Right. First things first: the deal to raise the US debt ceiling looks like it's in the bag. So can we get back to worrying about inflation and growth? We just had the non-farm payrolls numbers for May – another upside surprise on the headline jobs growth number. What to make of the report, as regards inflation, Fed etcetera?
Simon MacAdam
Yes. So actually, I think that there was more in the report to reassure the Fed than it was to worry them. So it's true that the headline payrolls number beat expectations once again. But if you look at the alternative household measure of employment, that actually fell by 300,000, doing a mirror image of the payroll report, and that household survey is the one that is used to calculate the unemployment rate. And, accordingly, with sort of big fall in employment and another rise in the labour force, the unemployment rate rose from 3.4 to 3.7%. So you had a chunky fall in employment in the household survey, a rise a 0.3 percentage point rise in the unemployment rate, and wage growth, average earnings growth, that moderated and came in line with expectations and to top it all off average weekly hours also ticked down to its lowest level since sort of the early part of the pandemic. So overall, there's more in that report to reassure the Fed than to worry it.
David Wilder
So reassurance for the Fed there. What are the other key data points that have come out this week that you've been focused on? Where's the global outlook looking now?
Simon MacAdam
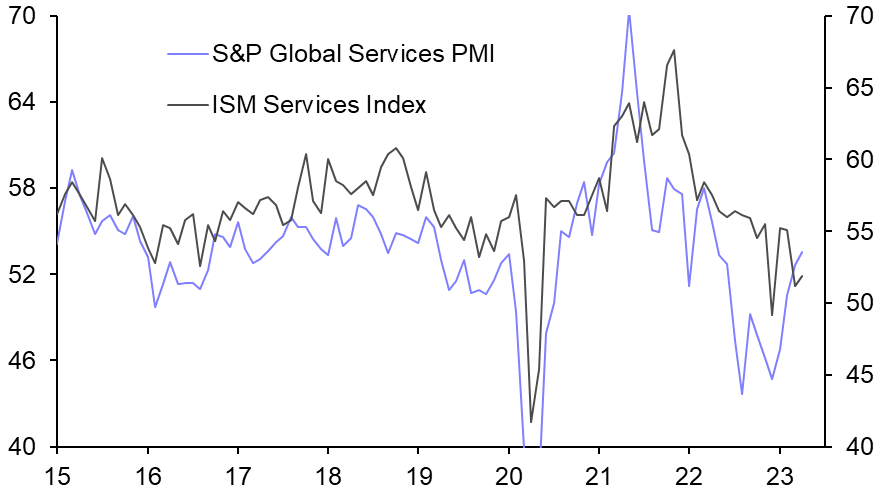
Yeah, we had a raft of business surveys this week, we had the economic sentiment indicators out of Europe, the manufacturing PMIs globally, the ISM index, manufacturing index, for the US, but also the JOLTS survey as well. Wrapping all that together, I think the big picture from the activity surveys is that the outlook for the manufacturing sector is quite bleak. So it's true that output right now, and sort of in the very, very near term, is being propped up by improvements in supply – so product shortages, alleviating and so forth – but orders, new orders are falling. So actual demand is contracting, if you look at the new export orders index of these PMI and ISM surveys, these indices are falling to new cycle lows. We'd already written about this on the Global Economics team earlier this week that world trade has been really struggling in recent months, I think it's fallen by about 3% from its peak late last year. These surveys are just pointing to further outright declines in the level of world trade activity. And specifically looking at the ISM index in the US, again, the new orders are going back to sort of cycle lows, so pushing back against the idea that the US economy is going to avoid recession. Of course, the flip side of the fact that demand is weakening in the manufacturing sector is that price pressures are abating. So we have the price indices, both input and output prices in these business surveys, these indices fell below the 50-no change level. So what that is essentially saying is that if you take the manufacturing sector globally, a net majority of firms are now reporting outright declines in the prices of manufactured goods. So there's some good news there in terms of the pipeline price pressures from a sort of goods inflation point of view
David Wilder
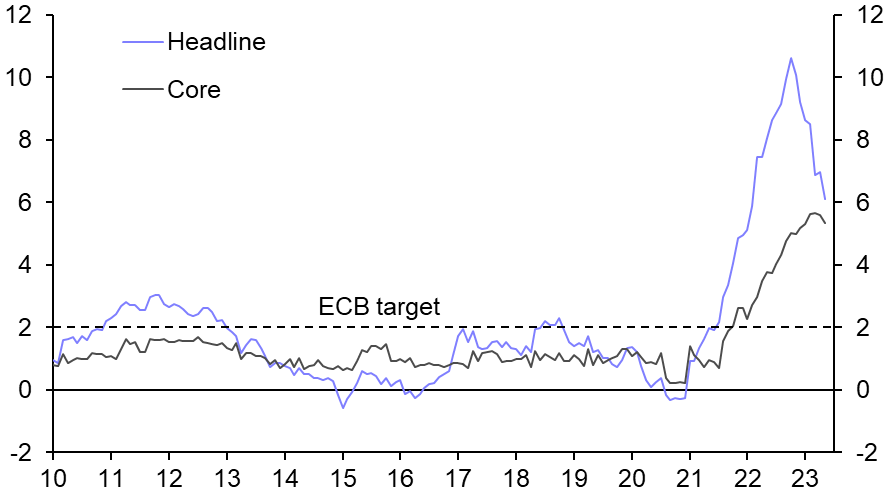
Goods prices falling. What about on the services side? I did want to pick up on one of the other big data points this week. That was inflation numbers from the euro-zone, headline and core inflation both off pretty sharply for May. At the same time, though the latest employment data for the euro-zone showing a pretty tight labour market still. How does that feed into the inflation story?
Simon MacAdam
Yeah, this was certainly an encouraging HICP print for the ECB in the sense that we did see the big falls and headline inflation. We saw a second consecutive monthly fall in core inflation. And I think most encouragingly of all, in sharp contrast to the UK – remember last week we got the UK CPI numbers and services inflation rose in the UK which would have been much to the alarm of the Bank of England – but services inflation in the euro zone has fallen and that's good news for the ECB. But as you say, we also learned this week that the unemployment rate in the euro-zone reached a fresh record low. So on the one hand, you've got some encouraging signs from the inflation data, but you've got a very, very tight labour market. And so consequently, I think it's still it's still early days for the ECB to think about stopping its hiking cycle, concluding its hiking cycle. In fact on Thursday Christine Lagarde gave a speech in which she said that there was “no clear evidence” of a sustained reduction in inflation that would reassure the ECB, so even the ECB themselves are saying this is too early. So consequently, a June hike is still on for the ECB, probably even a July 25-basis point hike too. So we're sticking with our forecast for the ECB’s deposit rate to peak at 3.75% in this cycle.
David Wilder
So you've spoken about weakness in the manufacturing sector. You're just talking now about euro-zone inflation dynamics. So when we look at the advanced economies as a whole is the disinflation story one about goods inflation?
Simon MacAdam
Primarily disinflation has been about energy inflation coming down very sharply over the past year. But increasingly, it’s also been – I mean particularly for the US but also increasingly and other advanced economies – it's also becoming a story of goods disinflation too. The most sticky and persistent part of the inflation story is in services. And this is why it's services but inflation specifically that is going to be drawing the most attention from people in central banks. Policymakers are really focused on the outlook for services inflation because that is ultimately the part of the inflation for the CPI baskets that are most driven by domestic factors over which they have control using monetary policy. So consequently, this is why it's encouraging that we've had, particularly in the case of the euro-zone, that we've started to see that perhaps services inflation has already peaked.
David Wilder
Nonetheless, still, couple more rate hikes to go in the euro-zone. Certainly some more in the UK as well after that shocking April CPI report. Potentially the Fed’s not done yet – to be seen. You had a report out in March explaining how monetary policy changes transmit through economies. And you concluded then that most of the tightening had yet to feed into the system. And that at the time only added to our conviction that most advanced economies were heading for a recession. Given where we are now looking at more of these rates coming? Presumably that means even tighter conditions, more constrained activity?
Simon MacAdam
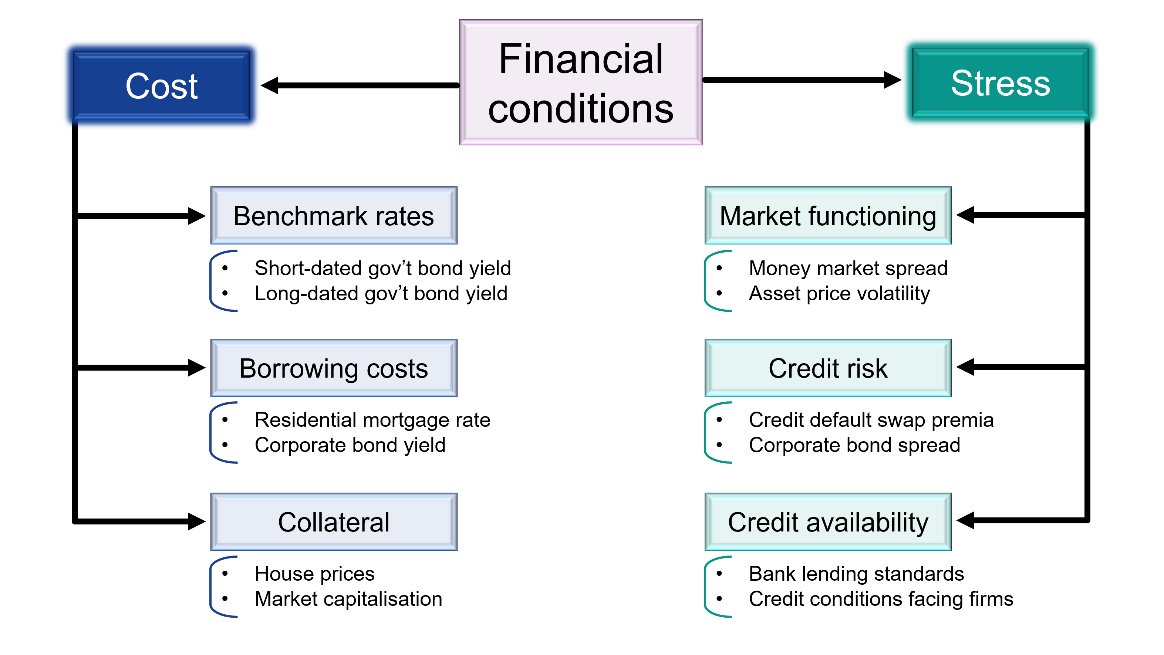
Yep, absolutely. I mean, compared to where we were since I wrote that report, we've at we've added in a couple of rate hikes, both on the US side of things and also in the UK. And because of the extra resilience of activity that we've seen in the opening months of this year. So yeah, I mean, it's true that long-dated bond yields have been coming back down again. But there are all sorts of elements of broad financial conditions that affect the real activity and the real economy that are still extraordinarily tight. For example, on Thursday, I refreshed our financial conditions, indices to take account of all the data that we've got for the whole month of May. And these FCIs are at still at the broadly the highest level since the global financial crisis in major advanced economies. So consequently, the story of tight financial conditions posing a significant headwind to growth in the second half of this year – that hasn't changed. So it's still the case that more than half of the effects of the aggressive monetary tightening cycle are yet to be felt.
David Wilder
So financial conditions still looking tight. What does that mean in terms of recession?
Simon MacAdam
I think it means that in the absence of really strong countervailing forces, the base case still has to be that there's going to be recessions in major advanced economies in the second half of this year.
David Wilder
That was Simon MacAdam from our Global team on the week's data and how they've shaped the economic outlook. Now, at the time I'm recording this, the S&P 500 is up nicely thanks to that jobs report. What's more, a broad range of the index’s components are doing well. That's not been the case for most of this year. The S&P 500 may seem to have had a good 2023, suggesting the US economy is in good shape as well. But look a bit closer at was has driven the benchmark and a very different picture emerges. Oliver Allen and Adam Hoyes from our Financial Markets team have been analysing what's been driving the S&P this year and they've come up with some striking conclusions about an intensely-focused rally and one that looks unsustainable. I spoke to them earlier and I started by asking Oliver what's been going on.
Oliver Allen
What's been happening with the S&P 500 has been really interesting. You've seen the index overall make pretty strong gains, pretty solid gains. Overall, the S&P 500 is up something like 10% in 2023 so far, but if you look under the hood, you kind of realise that there's a bit more to that story. So you've got a situation really where you have a very small number of the largest tech firms doing very, very well. And then the rest of the index. So most other large cap US companies have really gone sideways or they are they've gone down a bit. So there's different ways you can cut up the numbers. So sometimes you'll see people strip out the FAANG companies or strip out another basket of big tech firms. But the way we've done it is just to sort of chop the index up by size. So if you pick out the biggest five companies in the S&P 500, all of which are tech giants, you look at a market cap-weighted portfolio of those. So those five companies would have returned something like 50% year-to-date. So really blockbuster gains from those firms. If you look at the next 95 companies in the index, those have returned like 3%, so really quite mediocre gains. And then if you look at the next 400 companies so I suppose the rest of the index that's pretty much flat this year. So yeah, really a case to manage this year so far of the US stock market doing well overall but under the hood it's the big tech firms kind of leaving everyone else in their in their dust.
David Wilder
Quite striking, isn't it? So to just put some names on, even as companies like Nvidia, Apple, Google, and the like have been pushing up the headline index with these huge gains under the surface, as you say, you've got these blue chip names of US industry, Caterpillar, Coca Cola, Johnson & Johnson, etc at best badly underperforming the index, and at worse they're down double digits. What does all this say about where the stock market is going?
Oliver Allen
Yeah, I mean, like, you sort of indicate, David, I guess the first thing this suggests is that you shouldn't look at the headline number for the stock market and sort of go “oh the stock market is up 10% this year. Clearly, the economy is doing quite well”, I think what this narrowness of the stock market reading suggests is that investors aren't really all that positive about the kind of macro outlook for stocks, I think it's more a case of a sort of wave of techno-optimism giving a big boost to the to the tech giants. And as you say, a lot of other stuff really not doing that well. I mean, in terms of kind of where we go from here, I think the answer is a little bit nuanced really. On the one hand, it's definitely true that we've seen top heavy rallies in the past, right, like rallies where the stock market continues to go up for a long time but it's the biggest firms doing the best. So I guess if you think back to the kind of mid to late 1990s, and the sort of rally that morphed into the dotcom boom, that was a period where the stock market, the S&P 500 was doing very, very well. And within that the largest firms were doing best. And then I guess you can also look back if you if you gloss over that short-lived COVID sell off, if you look back to kind of 2019 to 2021 that was also a period where clearly we saw some pretty impressive gains from the S&P 500. And really the tech giants and the largest companies leading the charge, I suppose a very big difference between what was happening then and what was happening now and one we think that's very important when we're thinking about the breadth and narrowness that the stock market and what it means is that what we're seeing now is the biggest companies doing fantastic and then most of the rest of the of the index and mid cap and small cap companies doing pretty poorly. And that's quite a big change from what you saw in the in the mid to late 90s and in the early years of the pandemic where it was the big tech stocks doing best and large companies doing best but other companies in S&P 500 and also the mid-caps and small caps also making pretty respectable gains, even if those gains weren't quite as large. And I think if we're wondering, well is this is what we've seen lately sustainable. I think the lesson from history is really that really you can have these top heavy rallies in stocks, but you need to have a solid macro backdrop that’s a tide lifting all boats. So I mean, you had in the 1990s strong economic growth around, the time around the pandemic we had falling interest rates, getting a big boost of valuations. And I suppose from late 2020 onwards this strong economic recovery. And we're now asking is this going to continue and can the US stock market continue to deliver? I guess it really comes down to a question of well, is there going to be a positive macro backdrop that that supports stocks in general? And I guess on that front, we sort of have our doubts. So I guess we're kind of have the view that economic growth in the US and a lot of other advanced economies is going to disappoint over the rest of this year, essentially. And that is going to prove to be the stock market’s undoing.
David Wilder
So unlikely that these beaten down stocks start to follow the likes of Nvidia, Meta higher. Remind us what's our forecast for the S&P 500 this year.
Oliver Allen
So our forecast is for a end-2023 forecast for the S&P 500 of about 3800. So that compares to about 4200 now, so we're calling for a roughly 10% decline in the index from here. So not a kind of new bear market and not retesting the lows we saw late last year, but still a pretty downbeat outcome for stocks.
David Wilder
Adam I’d like to bring you in here because you've just done some more work on this issue. How unusual is it to see a small number of the biggest stocks in the index outperforming the way that these tech giants have in recent years.
Adam Hoyes
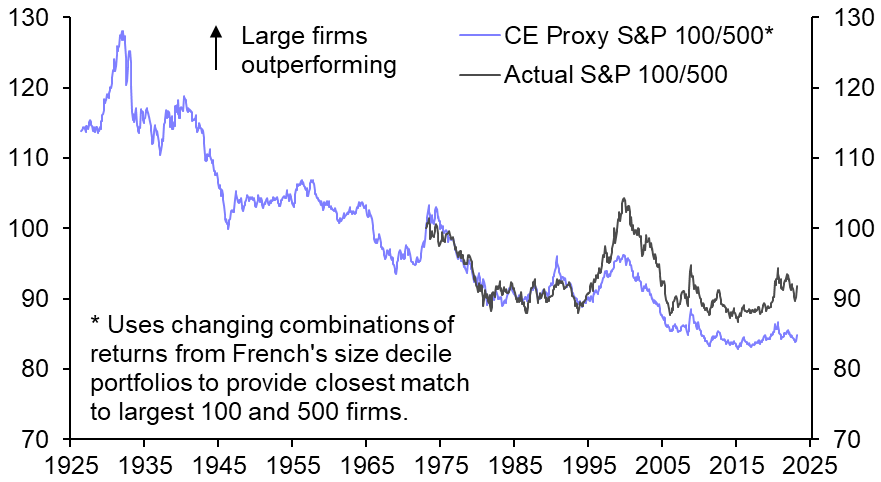
It's certainly not the norm I'd say. We've been doing a little bit of work over the last week putting together some more historical data. So, we've been using a data set compiled by Kenneth French that goes back to the 1920s and splits up the stock market based on size. And the main observation from that really, is that the smaller firms over the long run tend to do better than the largest firms in the index. That's not to say that we haven't had periods like this before where the largest firms have done well there’s has been notable what periods where it's happened. As Ollie mentioned in the 1990s, for example, but yeah, over the long run it's certainly not the norm and smaller firms do tend to outperform.
David Wilder
So what lies ahead then for these big stocks relative to the rest of the market, and you've talked about historical examples, in this case, is there a chance they remain outperforming or are we going by what the history books are telling us?
Adam Hoyes
It certainly wouldn't be unheard of for the largest stocks that go on outperforming for maybe another year or two. When the largest caps have outperformed the rest of the market to the extent that they have done over the last year or so, there's certainly been historical examples where they've were gone on doing that for the next for the next two years. But one of the one of the key takeaways from the data work we've been doing is that back to 1926 it has never been the case that the largest stocks go on to outperform the rest of the market over the next five years when they're in a position they are now. So the sort of near term is maybe a little bit more uncertain. But I think we'd be pretty confident say that the large cap stocks won't provide better returns over the next five years.
David Wilder
You mentioned these historical examples, can you talk through some of them.
Adam Hoyes
I think we'd probably say that there's three examples that potentially resemble what we expect to play out in the market over the next few months and years. The first is perhaps 1929. Without scare mongering – that's not that's on our forecast for a crash at that scale. But it is quite interesting that in the final months before the Great Crash, the largest listed companies did outperform the rest of the market. And they then continued to hold up better during the collapse over the subsequent years. And we sort of see a similar type trend in the early 1970s. So the better returns from the largest firms are also a feature of the months before the peak in the S&P 500 in late 1972. And they then avoided the worst of the losses during the sell-off in 1973. And then finally, the large caps propped up the S&P 500 as it treaded water in the very late 1980s, 1989 and into early 1990. And then it avoided the worst of the drop in the market later in in 1990. So we think there's a real historical precedent for what we expect to play out over the next few months and years in that we see the largest caps outperforming the final stages of a rally. And then they tend to probably sort of hold up a little bit better as the market sells off later on.
David Wilder
Ollie can I ask you – is this just a variant of the value versus growth story?
Adam Hoyes
Yeah, I there's a lot of overlap between value versus growth. I mean, it depends what basket of growth stocks and what asset value stocks you look at. But another prism to look at this through is well, we've seen, for example, the largest companies in the MSCI USA Growth Index, which again happen to be those big tech firms, they make up a pretty big share, if not around half of the MSCI USA Growth Index. So those have clearly done very well. Other growth stocks have put in a middling performance and then values kind of struggled a little bit this year. And I think yeah, it is to a large extent a value versus growth story what's happened really is the investors have run up the valuations of some of the biggest US tech giants. And I suppose the reason they've done that is because they're banking on AI, really, it seems driving up kind of renewed period of explosive earnings growth for those companies. And I think if you look at metrics of what's the valuation gap between growth stocks and value stocks in the US that's hit new highs recently. So again, we're very much in the situation, again, like we were at early on in the pandemic, and perhaps to some extent in the dotcom boom too where investors are unusually willing to pay a very high premium for growth, basically. So for that, to really be justified these large tech companies are really going to have to deliver over the next few years.
David Wilder
So a longer term view is still that we'll get to the point where value will be outperforming growth.
Yeah, it's always hard to tell exactly when you might have that reversion. It kind of feels like people have been banking on that reversion back to value for for some time, it seems to kind of happen. Sometimes you get a break of six months or a year with values doing better, but it really has been growth’s period for the past 10-15 years. Yeah, I think even if we can't explain exactly when we're of the view that that valuations gap between between value and growth is pretty compelling. And as Adam said earlier, if you look one to two years ahead, it's kind of hard to make much of a call. But if you're looking five years ahead plus, I think there's a pretty strong case really for some outperformance of value relative to growth.
David Wilder
That was Oliver Allen and Adam Hoyes on the narrow and unsustainable US stock market rally. I'll post their latest analysis on this in the show notes. But if you have access to CE Advance, our premium platform, you get our complete US macro analysis, all our market insight, as well as proprietary data like Simon's Financial Conditions Indices. Learn more about that on our website, capitaleconomics.com. That's all for this week. You can subscribe to The Weekly Briefing via Spotify, Apple or wherever you listen to podcasts. But until next time, goodbye.