What will the global economy look like in 2050?
Below are excerpts from our latest annual Long Run Economic Outlook, a comprehensive analysis of how advanced and emerging economies will perform in the years to 2050. Access to the complete report, including extensive long-term forecasts, is available as part of a subscription to our CE Advance premium product or to our dedicated Long Run coverage.
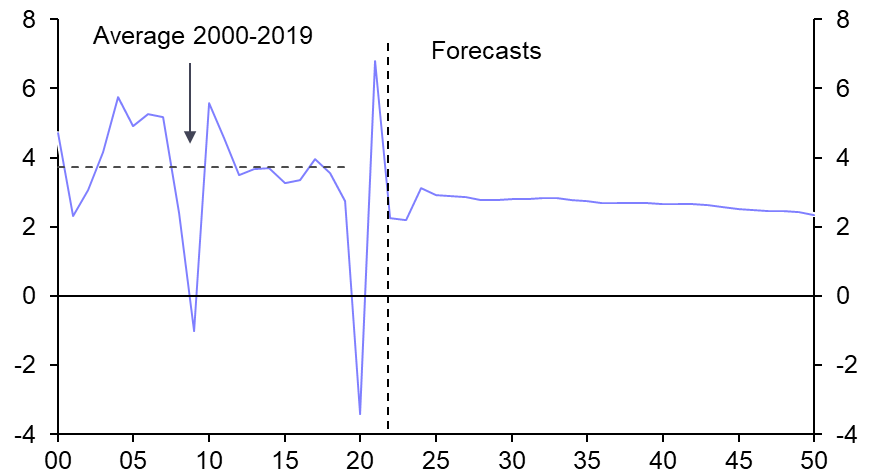
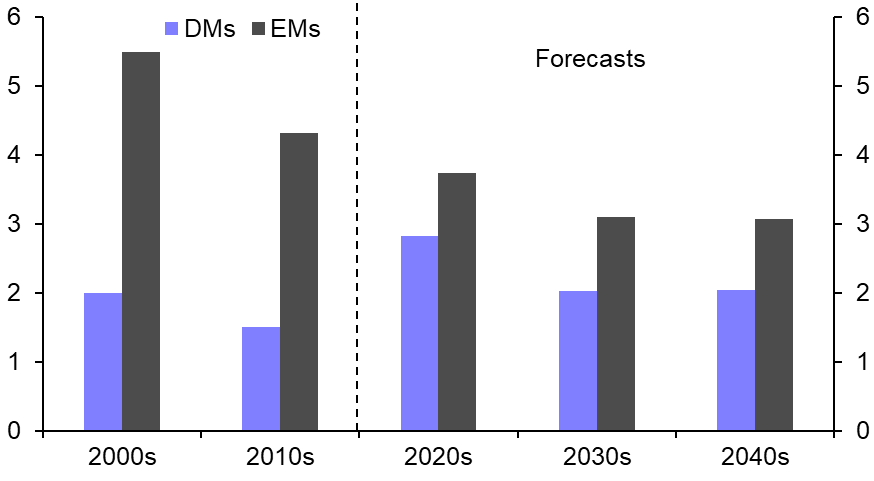
- The war in Ukraine has added to other shocks triggering a fracturing of the global economic system. This will reinforce some of the structural trends that were already set to weaken the long-term growth prospects of emerging markets (EMs), in particular. Although global GDP growth will bounce back after this year’s slowdown, it will settle at around 2.5%, below the average of 3.7% between 2000 and 2019. (See Chart 1.)
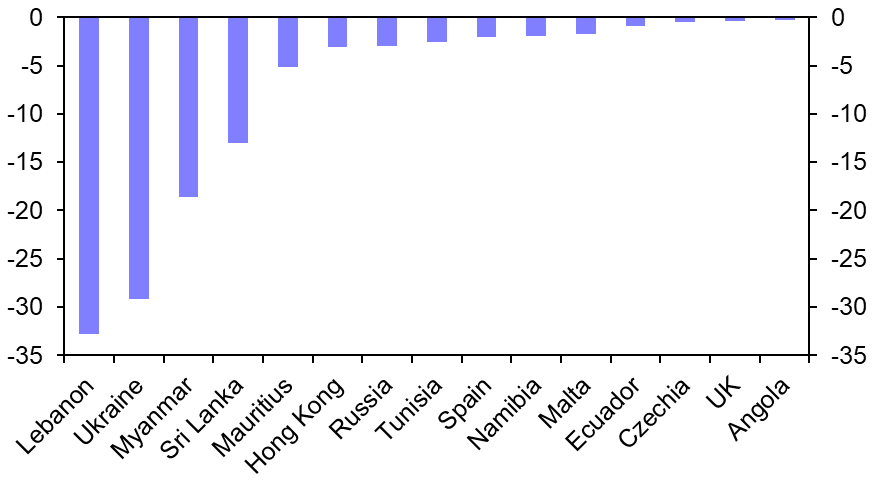
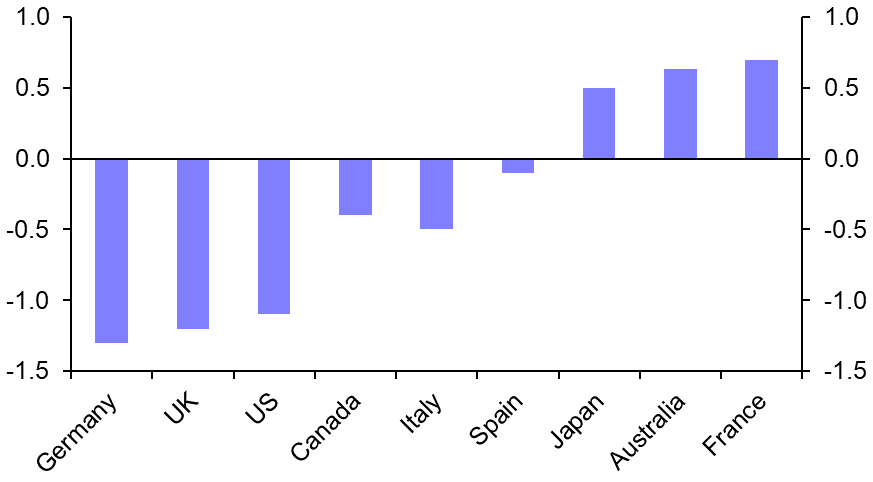
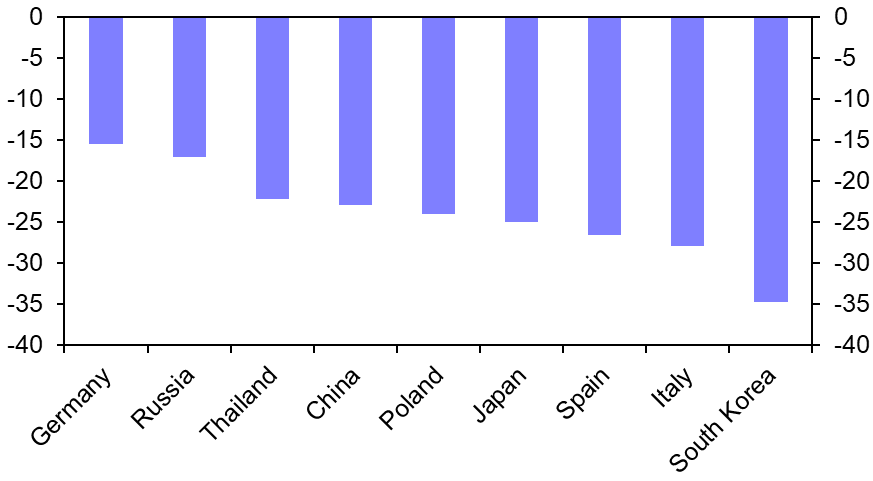
- Output is back to pre-pandemic levels in all but the few countries shown in Chart 2. In the big picture, the pandemic has caused only minor lasting damage. Nonetheless, productivity in some EMs has been dented by the impact on the capital stock, while labour markets in some developed markets (DMs) have not recovered fully. Migration has rebounded; instead, the problem is lower participation. (See Chart 3.) This may yet be reversed if governments tackle problems such as the rise in long-term sick.
- One long-term impact of the war will be to accelerate Russia’s shift towards isolation and hinder her catch-up. As for the West, the war has highlighted the threat of cyberattacks on critical infrastructure, although major economic ramifications would only be likely if an attack on the financial sector triggered a bank run.
- The war is also pushing the West to greater energy security. In the near term, this might delay progress towards climate ambitions, but ultimately it should accelerate the transition towards renewable energy. We are optimistic about the ability of technology and economic incentives to help reduce emissions.
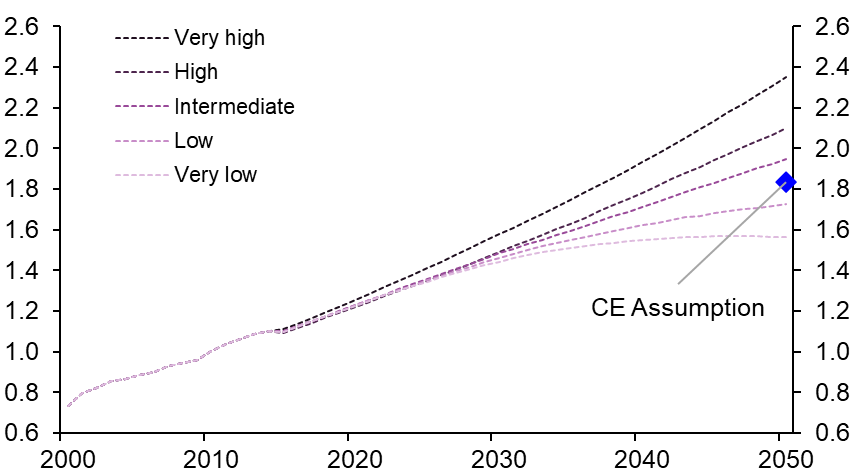
- Our assumption for carbon dioxide emissions is consistent with the global average surface temperature rising to about 1.8°C above its pre-industrial level by 2050. (See Chart 4.) This would be between the IPCC’s low and intermediate scenarios and mean that global warming has little effect on our economic forecasts to 2050 for most countries.
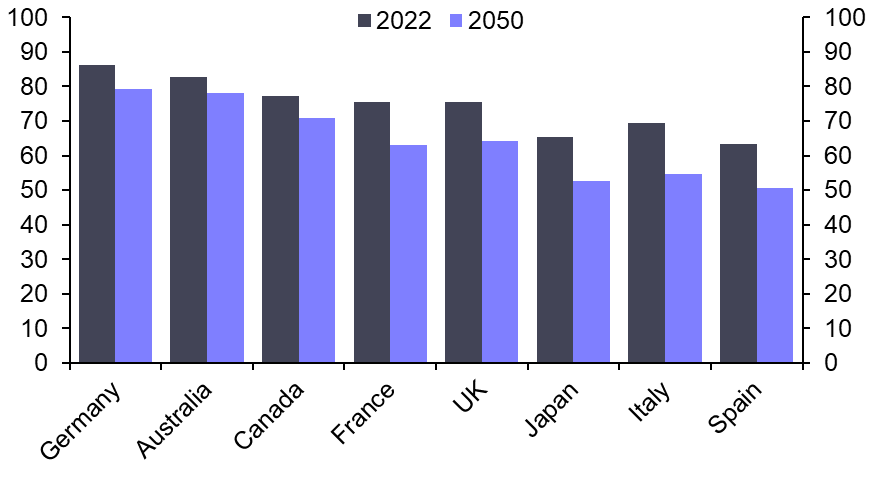
- Demographics remain a more important driver of the long-term prospects of most economies, with Chart 5 showing those countries facing the biggest fall in their working age populations over the coming decades. A pick-up in productivity growth may help to mitigate the impact of a declining labour force in DMs. The recent release of artificial intelligence (AI) chatbots has highlighted the potential opportunities created by generative AI. But China and those countries aligned to it will suffer from reduced technology and investment flows between the US and China blocs.
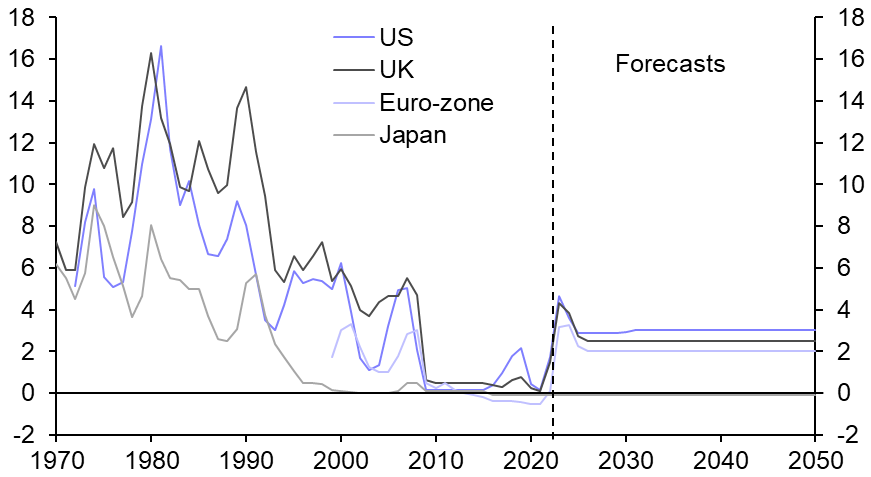
- The monetary tightening being implemented should be sufficient to ensure that inflation comes back to its target. But inflation is unlikely to return to the below-target rates seen before the pandemic. (See Chart 6.) The structural factors that previously pushed it down, including globalisation and demographics, have eased or gone into reverse.
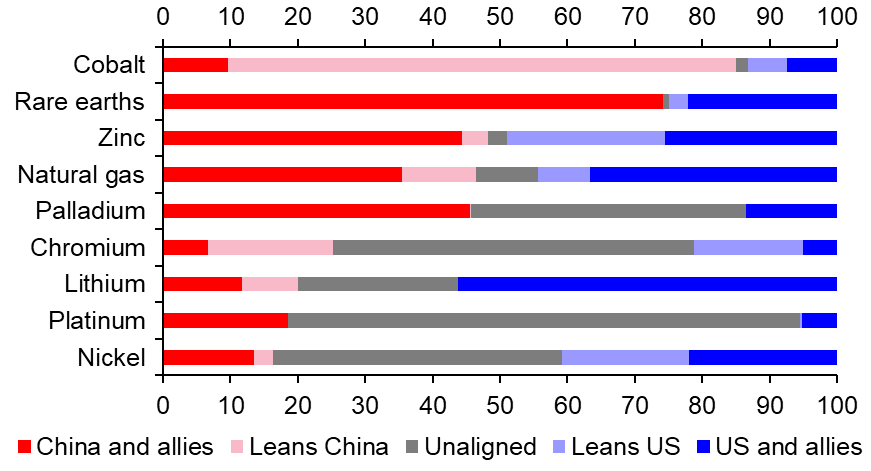
- And inflation could be more volatile than in recent decades. Global warming may cause more extreme weather events. And the China-led bloc has easier access to the raw materials needed for the green transition, which it might leverage for political means. (See Chart 7.) Assuming this volatility is biased to the upside, then inflation may average a little above target.
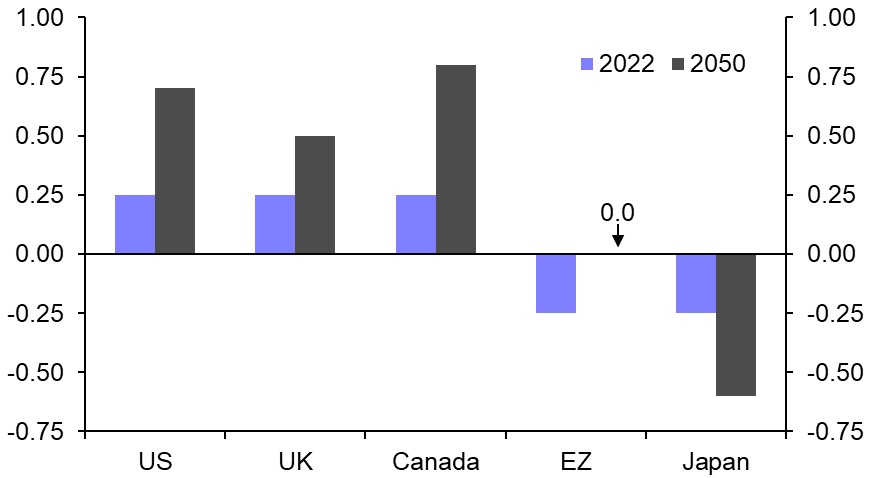
- Nominal interest rates have risen to the highest levels since 2008. But with equilibrium real interest rates still likely to be very low, they are likely to return to fairly low levels by historical standards once inflation falls. (See Chart 8.)
|
|
|
|
|
|
|
|
|
|
|
|
|
|
|
|
|
|
|
|
|
|
|
|
|
|
Sources: Refinitiv, Capital Economics, IPCC, IEA, UN |
World in 2050
India to rise to third place
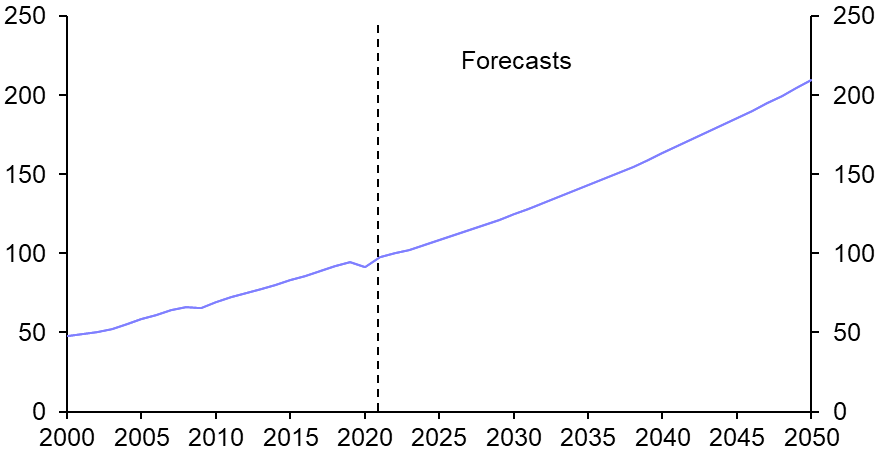
- Our long-term projections for real global GDP growth of 2.5% per annum imply that the world economy will be just over twice as big by 2050 than it was last year. (See Chart 9.)
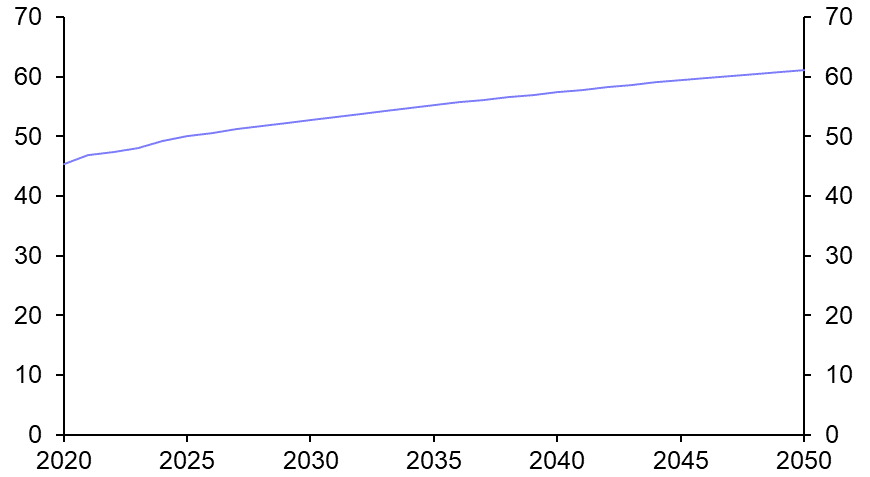
- EMs currently account for 47% of the world economy. With GDP growth in EMs set to outpace that in DMs, even if by a smaller margin than in the past, their share of the world economy will exceed 50% in around 2028 and reach 60% or so by 2050. (See Chart 10.)
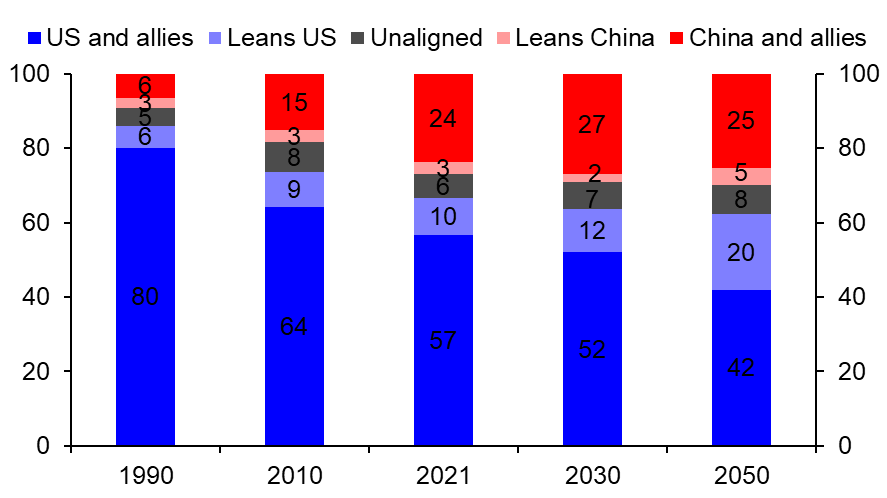
- Perhaps a more relevant way to view the world than the EM/DM split is the relative weight of the US-bloc and China-bloc. The share of global output accounted for by the China-led bloc increased sharply from 9% in 1990 to 27% today. (See Chart 11.) But this share is unlikely to be any bigger in 2050, in part due to the productivity-sapping effects of fracturing. And many of the faster-growing EMs, including India, are more aligned to the US.
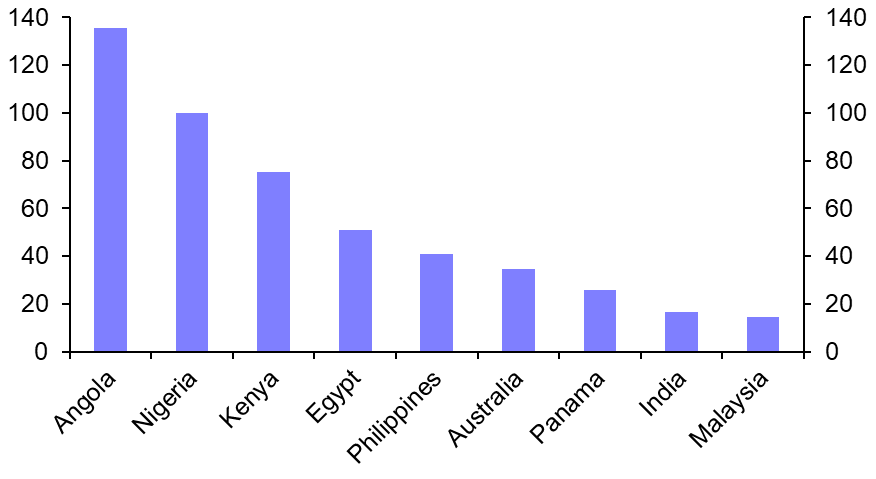
- The countries that have grown the most by 2050 will be those with rapid population growth, especially those in Sub-Saharan Africa. (See Chart 12.) But countries with the biggest growth of GDP per capita will be those that achieve the fastest productivity catch-up with countries at the technology frontier.
- These include countries that will benefit from the green transition (e.g. Chile). And some (e.g. Mexico and Poland) will profit from becoming bigger suppliers of products such as electronics as part of the reconfiguring of supply chains in the US and euro-zone. That said, none will see the type of growth rates that China enjoyed during its heyday in the 2000s.
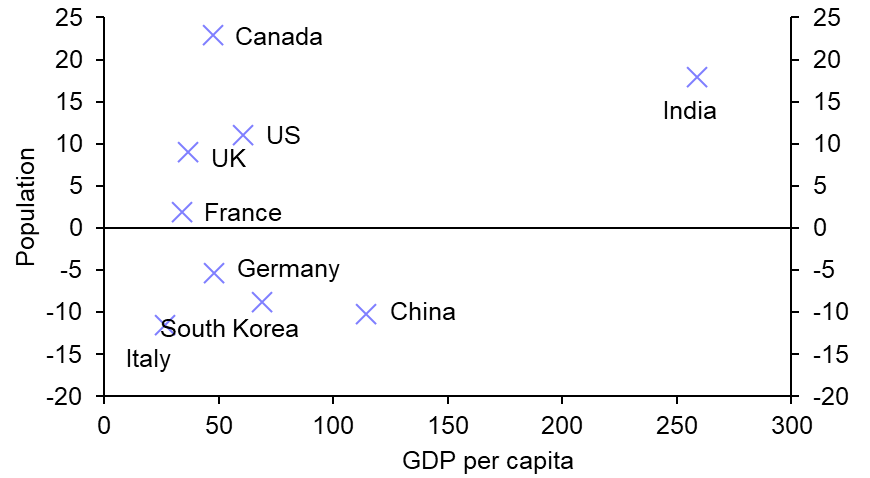
- Of the ten economies that are currently the biggest in the world, India stands out for being set to see strong growth of its population and GDP per capita. (See Chart 13.) By 2050, India will have gone from the 5th to the 3rd biggest economy in the world and account for the same share of global GDP as the euro-zone. Indonesia will have entered the top 10, and Italy dropped out. (See Table 19 on page 47.) Meanwhile, Bangladesh and Vietnam will jump up around 20 places to 15th and 16th place respectively. A falling population and a productivity-sapping emphasis on self-sufficiency will prevent China from overtaking the US as the biggest economy.
- We expect the US to retain the top spot as it drives new advances in areas like artificial intelligence. A rebound in investment should facilitate the use of this technology by other DMs and boost their productivity growth. But other factors such as structural rigidities will stop them catching up with the US in terms of GDP per capita; in fact, by 2050, most will have fallen further behind. (See Chart 14.)
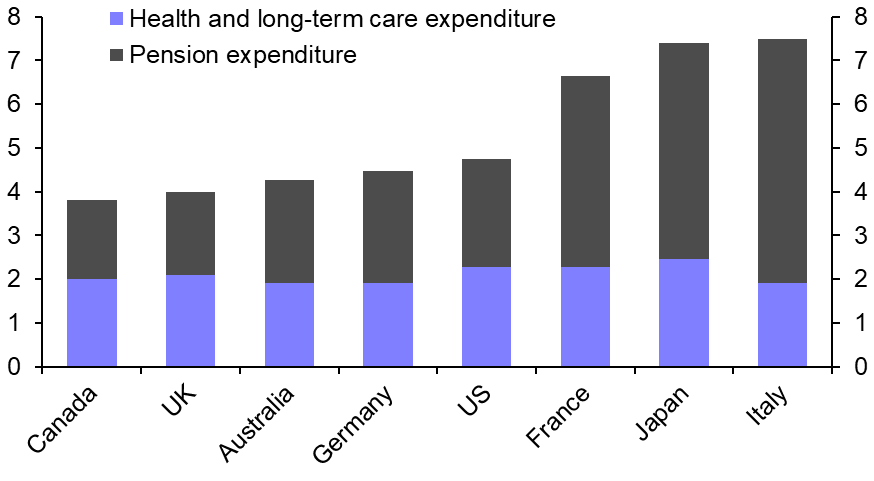
- In theory, there is scope for steady economic growth and fairly low interest rates to reduce public sector debt burdens as happened in DMs after the Second World War. But there is an added challenge now from ageing populations. (See Chart 15.) We assume governments take action to offset most of the rise in age-related costs. So, we expect debt to GDP in major DMs in 2050 to be close to current levels. But there is a risk that governments do not have the political will to do this. A far larger debt ratio might not matter for some countries such as the US, but elsewhere it could trigger a debt crisis.
- Inequality within DMs was rising before the pandemic and could revert to an upward trend if technological progress disproportionately benefits the better-off. That is one reason, alongside trend growth staying relatively low, why equilibrium real interest rates are unlikely to have risen much by 2050. (See Chart 16.)
|
Chart 9: Real World GDP (2022=100) |
|
|
|
|
|
|
|
|
|
|
|
Chart 13: % Change in GDP Per Capita & Population (2022-2050) (World’s 10 Biggest Economies) |
|
|
|
|
|
Chart 15: Projected Increase in Government Expenditure Between 2021 and 2060 (% of Potential GDP) |
|
|
|
|
|
|
Sources: Refinitiv, UN, OECD, Capital Economics |

Try for free
Experience the value that Capital Economics can deliver. With complimentary access to our subscription services, you can explore comprehensive economic insight, data and charting tools, and attend live virtual events hosted by our economists.