Resilience giving way to recession
Q3 Global Economic Outlook
This is a sample of our Q3 Global Economic Outlook, originally published on 27th June, 2023. Some forecasts contained within may have been changed since publication. Access to the complete report, including extensive forecasts and near to long-term analysis, is available as part of a subscription to our CE Advance premium product or to our dedicated Global Economics coverage.
Most advanced economies have so far dodged the recessions that we, and many others, had expected to start in the first half of this year. The relative resilience of activity can be pinned on several supply- and demand-side props to growth, as well as the fact that the full effect of monetary tightening is taking its time to feed through. However, as the various tailwinds fade and interest rate hikes bite in advanced economies – and as the re-opening recovery fizzles out in China – the resilience of global activity in early 2023 is unlikely to last. We are forecasting mild recessions in the coming quarters in major DMs, which should help bear down on underlying inflation. That said, it will take a year or more for core inflation rates to close in on 2%, meaning that DM central banks will be later than their EM counterparts to ease monetary policy.
- As various tailwinds fade, interest rate hikes bite in advanced economies, and the re-opening recovery fizzles out in China, the resilience of activity in early 2023 is unlikely to last. Economic weakness should bear down on underlying inflation, although it will take a year or more for core rates to close in on 2%, meaning that DM central banks will be later than their EM peers to ease monetary policy.
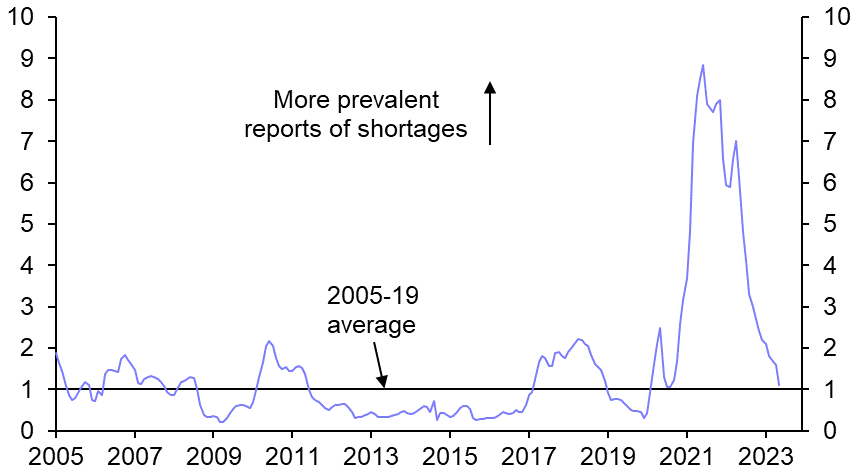
- We have not yet seen the meaningful recessions in major advanced economies that we and many others had expected. In part, this reflects the fact that industry has been supported by favourable supply-side factors including the alleviation of product shortages (see Chart 1), collapse of shipping costs, and falls in energy prices. These props could help industry in the quarters ahead, but the support they offer is likely to fade as final goods demand falters.
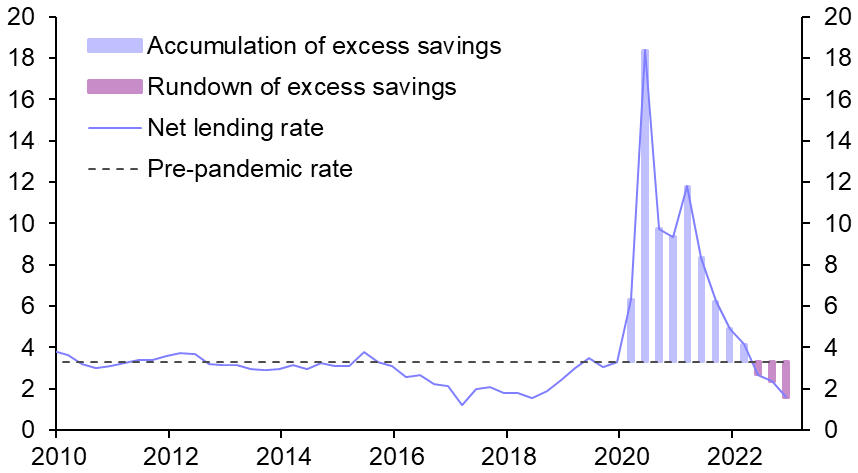
- Meanwhile, households have been depleting excess savings (see Chart 2) to sustain the recovery in services spending, which is still catching up to its pre-virus path. And firms’ recruitment difficulties have meant that a hiring backlog and reluctance to lay off workers has sustained labour demand.
|
|
|
|
|
|
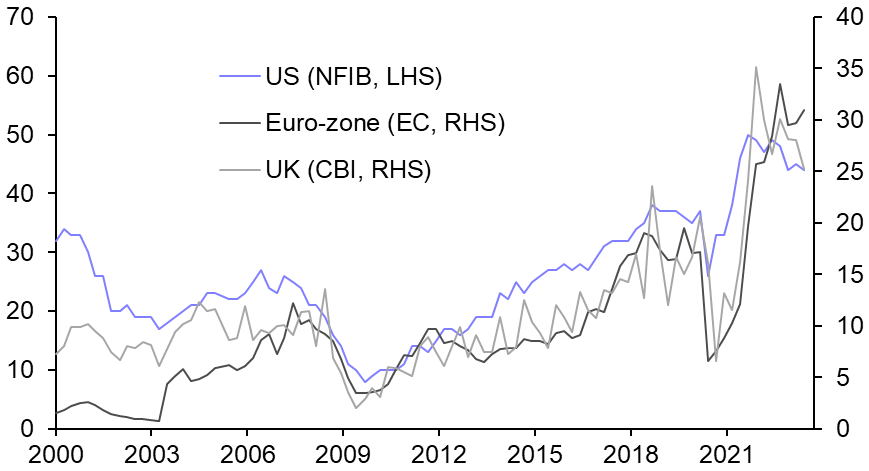
- There is still scope for services spending to normalise, and worker shortages remain acute (see Chart 3), so these props to demand are likely to endure.
- In addition to these supply- and demand-side props to growth, the relative resilience of the past six months can partly be explained by rate hikes taking a bit longer than expected to take full effect. In the case of housing, a stabilisation of mortgage rates has supported some housing markets. That said, there is growing evidence that the monetary policy headwind is mounting.
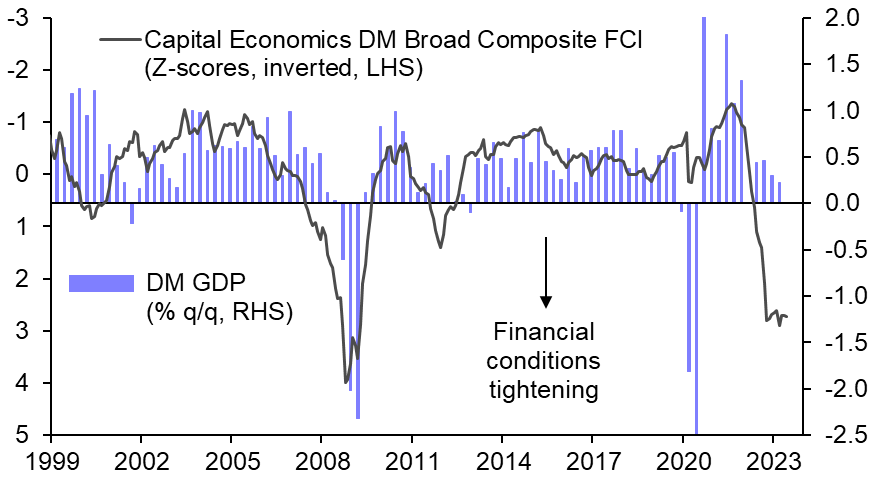
- For one thing, depositors are shifting their cash into less liquid forms of money that is less likely to be spent, as they take advantage of higher returns outside instant-access bank accounts. Net bank lending to households and firms has stalled in Europe and slowed in the US. And surveys generally suggest that credit demand is weakening in the face of high borrowing costs, and banks are tightening lending criteria. All in all, financial conditions are very tight and indicate that there is a significant likelihood of recession in advanced economies. (See Chart 4.)
|
|
|
|
|
|
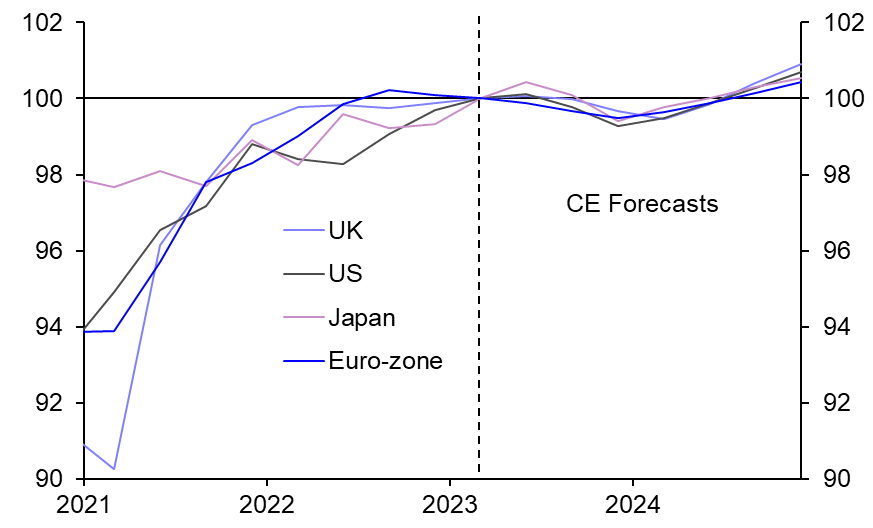
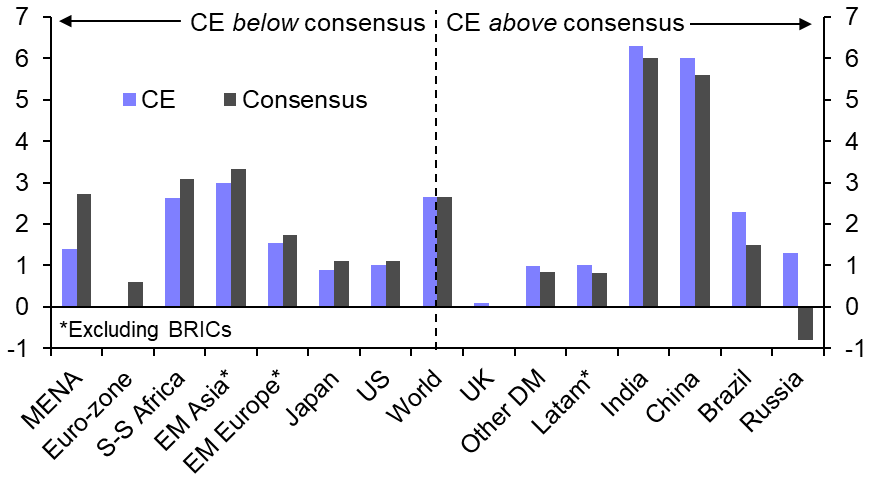
- Given the various offsetting props to growth, including the strength of private sector balance sheets, we think that recessions in major DMs will be mild, with peak-to-trough falls in output of less than 1%. (See Chart 5.) In the US, euro-zone, and Japan, our GDP growth forecasts are below consensus for this year. But we are less downbeat on the prospects for the major EMs, including China, where some of the recent disappointing data have led other forecasters to become overly pessimistic. (See Chart 6.)
|
|
|
|
|
|
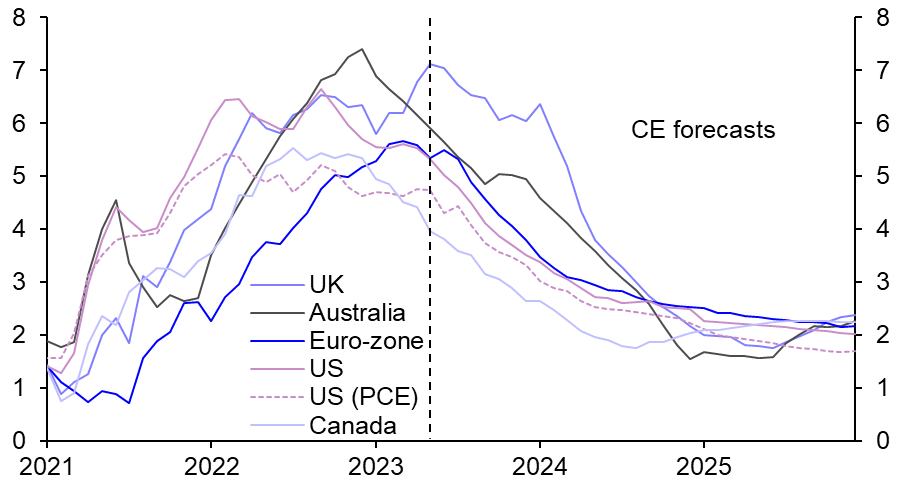
- Our below-consensus views on growth in major DMs mean we are cautiously optimistic that core inflation will recede in the coming years. (See Chart 7.) But given that we think labour markets will remain relatively robust compared to previous downswings – with unemployment rates rising only modestly – it will take time for core services inflation to ease, which is what central banks are especially focussed on.
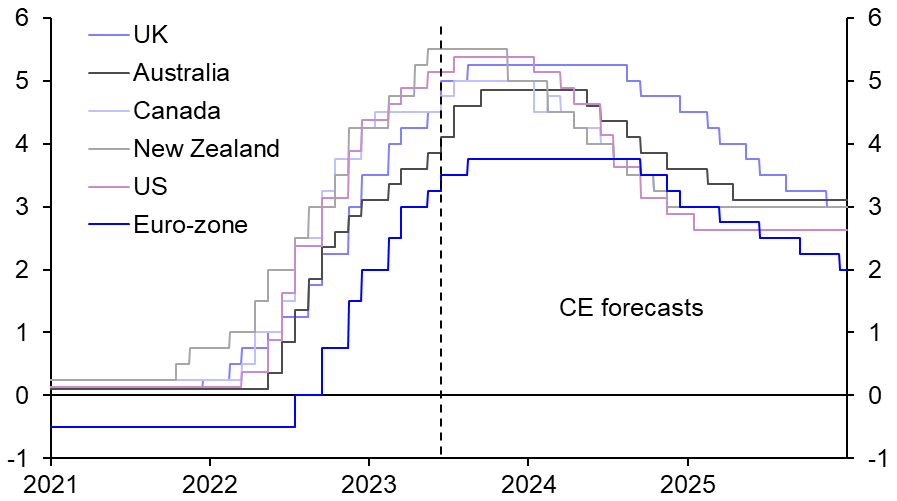
- So, with the exception of New Zealand, it will be 2024 before DM central banks are in a position to start cutting rates back towards neutral levels. (See Chart 8.) And given that core inflation will be higher in Europe, the ECB and Bank of England will wait the longest to cut. But once policy rates do start to fall, they are likely to fall faster than investors now anticipate in advanced economies. In contrast, in most EMs, we think that stickier core inflation than most expect will translate into slower policy easing than is currently priced in.
|
|
|
|
|
|
|
Sources: Refinitiv, S&P Global, Bloomberg, Capital Economics |
From a report written for Capital Economics clients by Jennifer McKeown, Simon MacAdam and Ariane Curtis, originally published on 27th June 2023.

Make faster informed decisions
CE Advance, our new premium product, equips organisations with actionable macroeconomic data and insight to stay ahead of the curve.