Trump policy mix still mildly stagflationary
Q3 2025 US Economic Outlook

Tariffs should have a one-off impact on the price level rather than triggering a more persistent bout of elevated inflation. With core inflation already running above target for several years, however, we suspect that Fed officials will be reluctant to dismiss the threat of second-round effects, particularly if labour market conditions loosen only slightly.
This is a sample of our latest quarterly US Economic Outlook, originally published on 26th June 2025. Some of the forecasts contained within may have changed since publication. Access to the complete report, including extensive forecasts, near to long-term analysis and interactive data resources, is available as part of our subscription services.
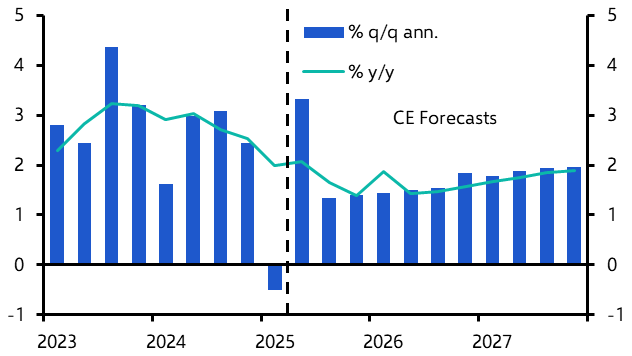
We expect tariffs to have only a modest impact on both real economic growth and price inflation. Admittedly, we do see annualised GDP growth slowing to around 1.5% in the second half of this year, but it should gradually recover from the second half of 2026 onwards. (See Chart 1.) We expect core PCE inflation to end this year a little above 3% which, given the lingering threat of a more persistent pick up, will prevent the Fed from cutting interest rates until early next year.
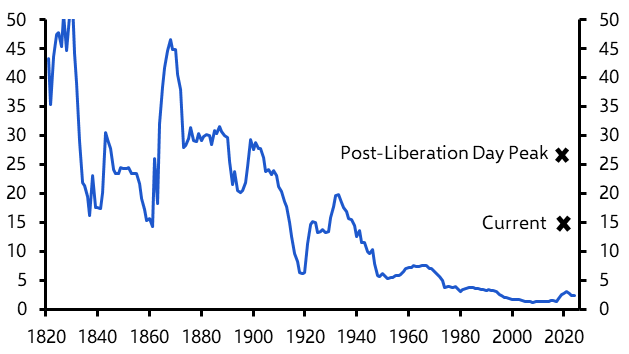
- We are sticking with our working assumption that the effective tariff rate will remain close to the current 15% level, as countries do “deals” with the Trump administration to maintain a 10% reciprocal tariff on most exports to the US. (See Chart 2.)
|
Chart 1: Real GDP |
Chart 2: Effective Tariff Rate (%) |
|
|
|
- The notable exception is China, which we expect to be subjected to an average tariff of 40%. President Trump will maintain higher tariffs on some goods, in particular steel, aluminum & motor vehicle imports. But we suspect potential tariffs on other goods, like pharmaceuticals, could be delayed or introduced at lower levels.
- As a general rule of thumb, any tariff hike/ threat that is severe enough to trigger a marked adverse market reaction will quickly be reversed, or at least scaled back. The risks to our tariff assumptions lie on both sides, with a possibility that the Supreme Court could still find that Trump cannot legally impose tariffs via the IEEPA, which has been used to justify the country-specific levies.
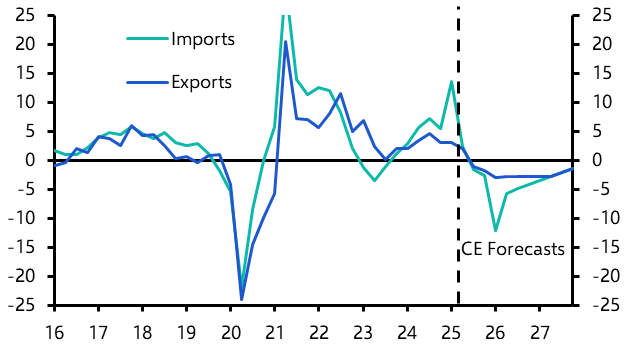
- Imports have already dropped back after the first-quarter surge. Despite the lack of exchange rate offset from the tariffs, with the trade-weighted dollar actually falling, we anticipate only a modest 5% further decline in imports over the next 12 months. (See Chart 3.) With most other countries implementing only modest retaliatory tariffs, the impact on US exports should be similarly muted.
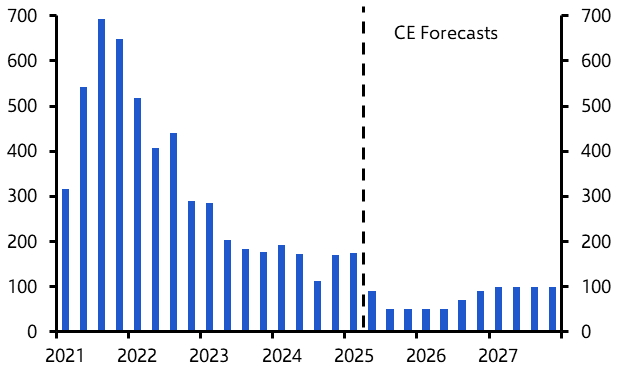
- As GDP growth slows, we expect gains in payroll employment to fall below 100,000 per month. (See Chart 4.) Nevertheless, with the ongoing crackdown on immigration restricting labour supply growth, we would also expect the unemployment rate to remain low, rising to a peak of only 4.5%.
|
Chart 3: Real Imports & Exports (%y/y) |
Chart 4: Change in Payrolls (000s, Monthly Ave) |
|
|
|
- Congress is close to finalising the budget reconciliation, which will cost around $2.5trn over the next decade. Nevertheless, it should be largely offset by the additional revenues raised by the tariffs. (See Chart 5.) The good news is that the budget deficit should remain broadly unchanged. The bad news is that deficit is currently 6% to 7% of GDP, at a time when the net debt burden is approaching 100% of GDP. (See Chart 6.) With interest rates no longer close to zero, the Federal finances are clearly on an unsustainable path. A crisis could still be years away, though.
|
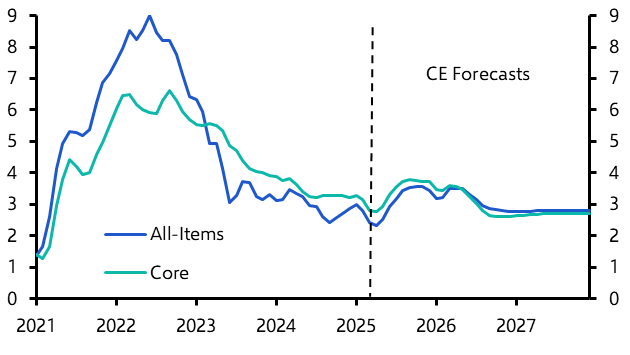
Chart 7: CPI Inflation (%) |
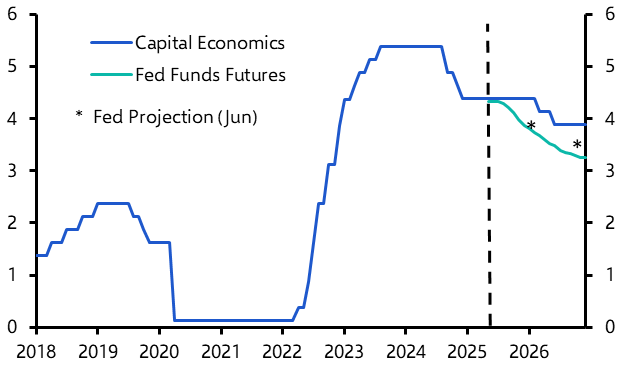
Chart 8: Fed Funds Rate Expectations (%) |
|
|
|
|
Sources: LSEG, CBO, Federal Reserve, Capital Economics |
- We still expect the net impact of Trump’s trade, fiscal, immigration and deregulation policies to be mildly stagflationary. With tariff revenues quickly being recycled into the economy via additional tax cuts included in the budget reconciliation, however, the hit to the real economy should be quite modest. We expect annualised GDP to slow to around 1.5% in the second half of this year and first half of next year, before gradually accelerating after that.
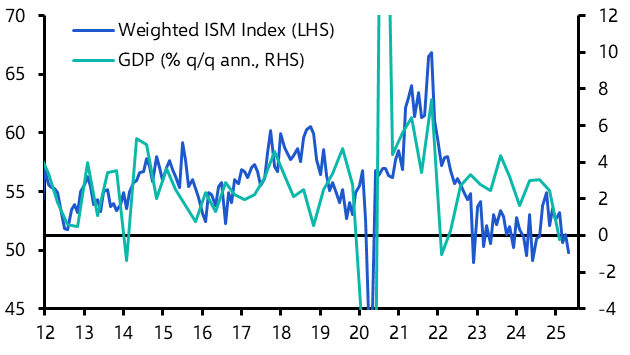
- Admittedly, the survey data remain weak. (See Chart 9.) But the activity surveys have proved to be overly pessimistic for the past several years now, while consumer confidence measures have been a poor guide to actual spending. The hard activity data have remained resilient, albeit in part because tariffs have not yet triggered a big resurgence in price pressures.
- After a slowdown in the first quarter, partly due to the unseasonably severe winter this year, consumption growth is on track to rebound to 2.5% annualised in the second. (See Chart 10.)
|
Chart 9: ISM Activity Indices & GDP |
Chart 10: Consumption & FSDPP (%q/q ann.) |
|
|
|
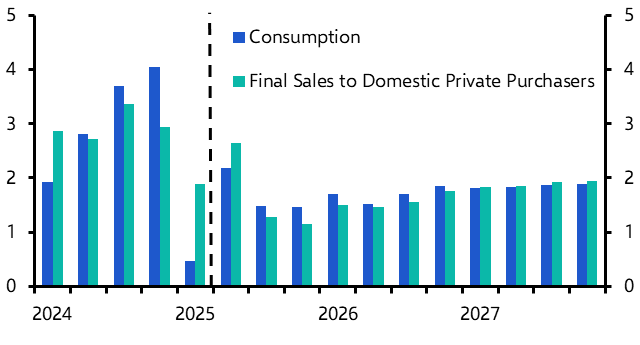
- Putting aside the volatility inherent in the net trade and inventories data, final sales to domestic private purchasers (FSDPP) – a good gauge of underlying economic strength – is on track to expand at a solid 2.2% annualised pace over the first half of this year. That said, some of that strength reflects pre-tariff front-running, particularly in spending on motor vehicles and investment in IT-related equipment.
- Nevertheless, we do anticipate a slowdown in both consumption and FSDPP growth in the second half of this year, as tariff-related price increases and slower employment growth limit the gain in real incomes. At the margin, the resumption of student loan debt collections will weigh on consumption too.
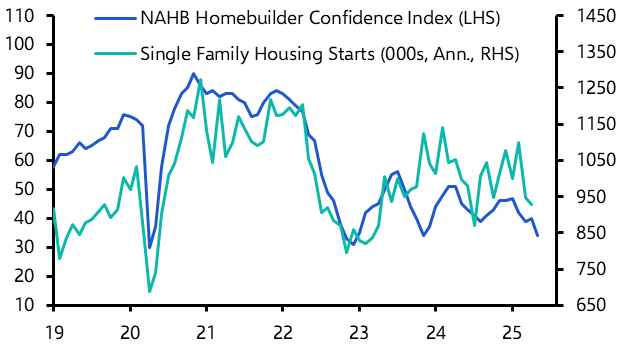
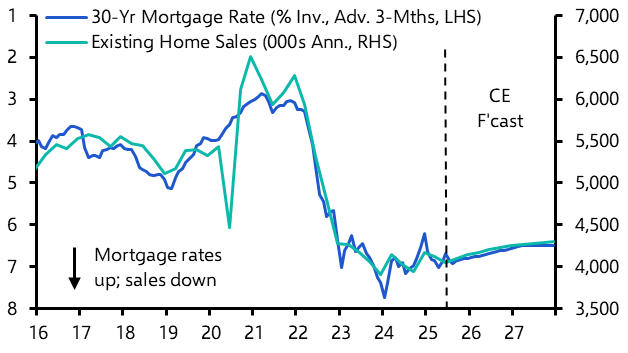
- Housing has been one notable area of weakness in recent months. Homebuilder confidence, housing starts and even home prices have all been dropping back. (See Chart 11.) With the 30-year fixed mortgage rate still uncomfortably close to 7%, and likely to remain at around that level for some time now, we expect any rebound in existing home sales this year to be very limited. (See Chart 12.)
|
Chart 11: Housing Starts & Homebuilder Confidence |
Chart 12: Existing Home Sales & Mortgage Rate |
|
|
|
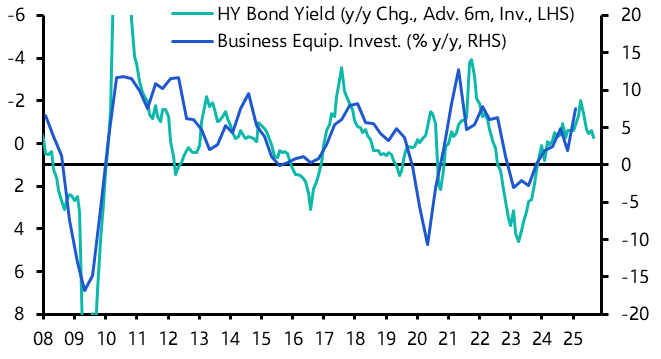
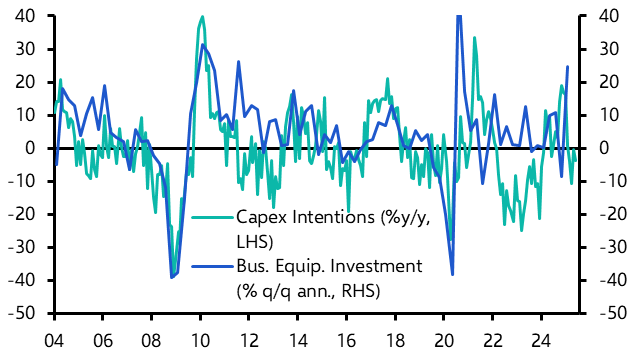
- The resurgence in long-term interest rates also points to a moderation in the growth rate of business equipment investment. (See Chart 13.) Admittedly, equipment investment expanded at a very rapid pace in the first quarter, but we suspect that was mostly tariff front-running. Elevated policy uncertainty more generally is weighing on survey-based measures of capex intentions, which also points to a slowdown in equipment investment growth. (See Chart 14.)
|
Chart 13: Equipment Investment & Bond Yield |
Chart 14: Equipment investment & Capex Intentions |
|
|
|
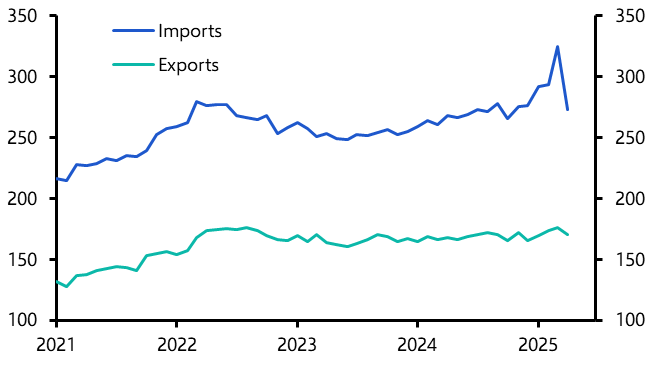
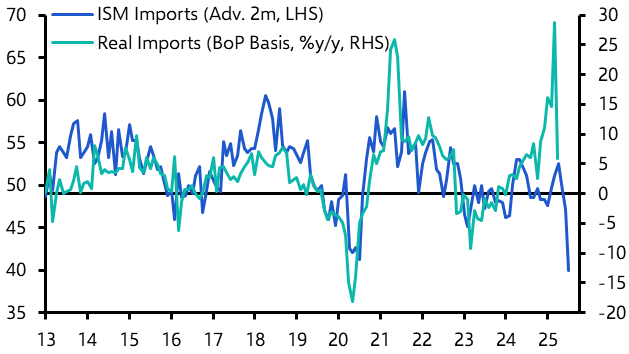
- As we noted above, a rise in the effective tariff rate to around 15%, from 2.5%, would probably be consistent with a 5% decline in real imports over the next 12 months. After initially surging ahead of the ‘Liberation Day’ announcement, goods imports have dropped back to normal levels. (See Chart 15.) The survey-based evidence does point to an even more marked drop back in imports right now. (See Chart 16). But with tariffs being scaled back, we expect that the ultimate decline will be modest, even after allowing for the dollar’s post-announcement depreciation.
|
Chart 15: Real Goods Imports & Exports ($bn) |
Chart 16: Real Imports & ISM Imports Index |
|
|
|
|
Sources: LSEG, Capital Economics |
Capital Economics clients get the full analysis, including:
- Why we expect the downward trend in employment growth to continue as the economy slows, but the immigration crackdown to limit labour force growth and the rise in the unemployment rate by extension.
- How, if tariffs stay in place, core inflation will end the year just above 3 percent. That’s lower than under full ‘Liberation Day’ rates. Inflation should ease in 2026 but likely won’t hit 2 percent without tariff cuts or a sharper slowdown.
- Why, if we’re right and the tariffs do trigger a more marked pick-up in inflation later this year, then we would expect the Fed, worried about potential second-round effects, to delay cutting interest rates until early next year.
This is a sample of the 13-page US Economic Outlook prepared for Capital Economics clients, published on 25th June 2025 and written by Paul Ashworth, Stephen Brown, Thomas Ryan, Bradley Saunders, Alexandra Brown and Harry Chambers.
Get the full report
Trial our services to see this complete 13-page analysis, our complete US macro insight and forecasts and much more