Q3 US Economic Outlook: Consumers beginning to feel the pinch

We expect core inflation to be back to the 2% target by early next year, allowing the Fed to begin cutting interest rates from this September.
This is a sample of our latest quarterly US Economic Outlook, originally published on 25th June 2024. Some of the forecasts contained within may have changed since publication. Access to the complete report, including detailed forecasts and near to long-term analysis, is available as part of a subscription to our CE Advance premium platform or to our dedicated US Economics coverage.
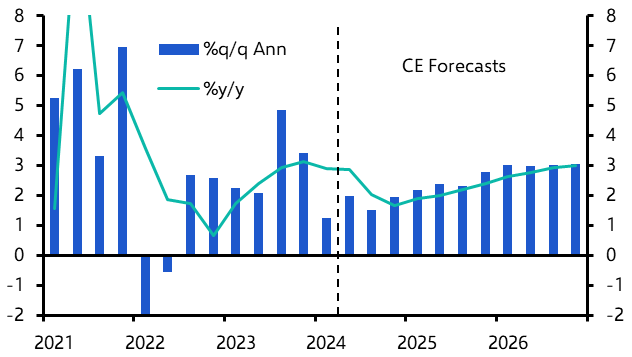
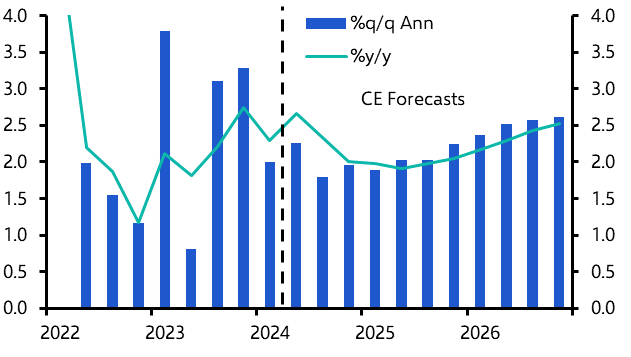
US GDP growth will remain a little lacklustre this year but, as the shift in monetary policy begins to boost rate-sensitive spending, growth should reaccelerate in 2025 and beyond. The presidential election adds to the uncertainty. We are worried that tariffs and immigration curbs imposed in a second Trump administration could be stagflationary.
- We expect core inflation to be back to the 2% target by early next year, allowing the Fed to begin cutting interest rates from this September. GDP growth will remain a little lacklustre this year but, as the shift in monetary policy begins to boost rate-sensitive spending, growth should reaccelerate in 2025 and beyond. (See Chart 1.) The presidential election adds to the uncertainty. We are worried that tariffs and immigration curbs imposed in a second Trump administration could be stagflationary.
- We are nevertheless confident that the first signs of an AI-related productivity boom will begin to show up soon, and expect GDP growth to accelerate to 3% in 2026. And, crucially, without triggering any resurgence in inflation.
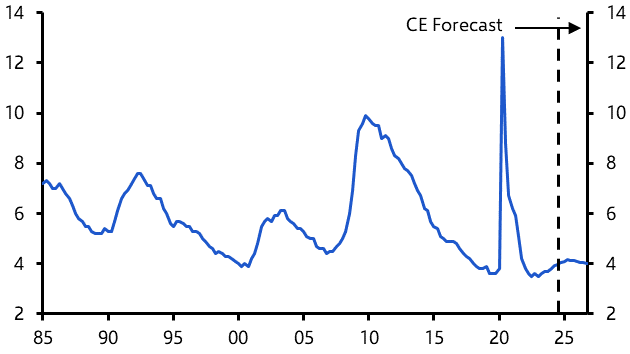
- The unemployment rate will continue to edge gradually higher, albeit as much due to increasing labour supply – thanks to strong immigration and rising participation – rather than any genuine weakness in labour demand. (See Chart 2.)
|
Chart 1: Real GDP |
Chart 2: Unemployment Rate (%) |
|
|
|
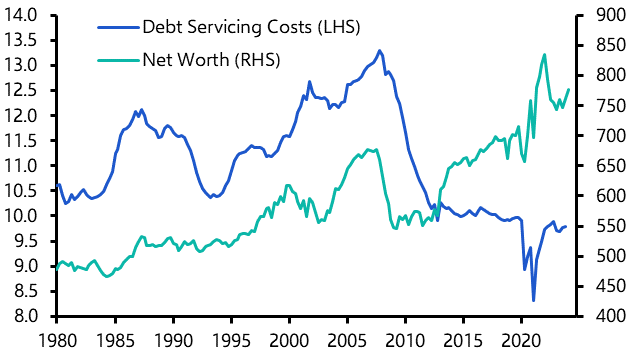
- Consumption growth will continue to underpin this economic expansion, with households still insulated from the impact of higher interest rates by the higher prevalence of fixed-rate debt. (See Chart 3.) Wealth gains generated from the stock market boom and the resilience of house prices will also provide a boost to consumption, albeit mostly for households in the top half of the income distribution.
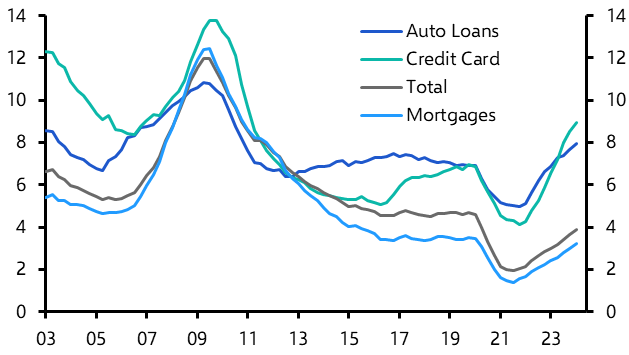
- Those at the lower end of the income distribution, who have probably already exhausted pandemic-era savings, appear to be struggling a little more, however, with credit card and auto loan delinquencies now rising more rapidly. (See Chart 4.)
|
Chart 3: Household Net Worth & Debt Servicing (% of Income) |
Chart 4: Household New Delinquency Rates (%) |
|
|
|
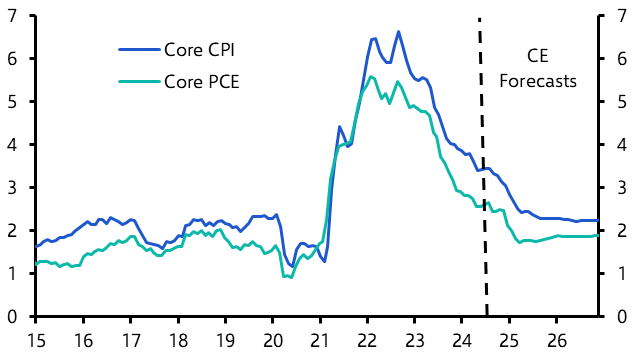
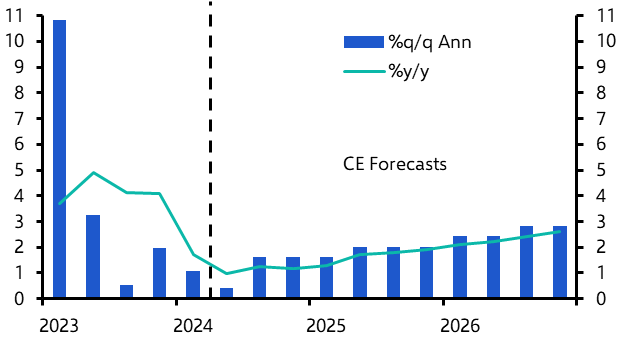
- After a shock to start this year, the better price data in April and May leave us more confident that core PCE inflation will be around 2.5% at year-end and should converge on the 2% target in the first few months of next year. (See Chart 5.) In particular, the combination of moderating nominal wage growth and faster productivity growth will keep a lid on unit labour costs, which is the key driver of labour-sensitive supercore services inflation.
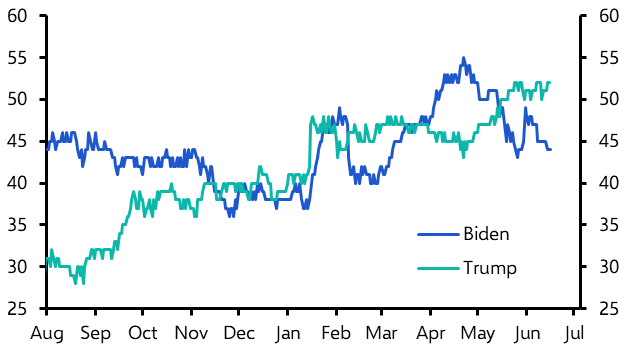
- The presidential election is still too close to call. (See Chart 6.) A win for Joe Biden would maintain the status quo. A win for Donald Trump could usher in massive increases in import tariffs and much tighter restrictions on immigration, possibly even mass deportations. If Trump sticks to his stated policies that could trigger a resurgence in inflation, while at the same time risking a recession.
|
Chart 5: Core Inflation (%) |
Chart 6: Presidential Election Betting Odds (%) |
|
|
|
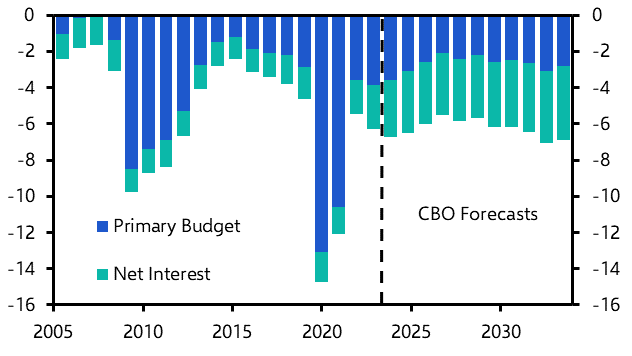
- Given the already adverse outlook for the budget deficit (see Chart 7), we don’t expect either candidate to promise any new deficit-financed fiscal stimulus, although both would move to extend most of the Trump-era tax cuts, worth up to 1.5% of GDP per year, which are scheduled to expire at end-2025.
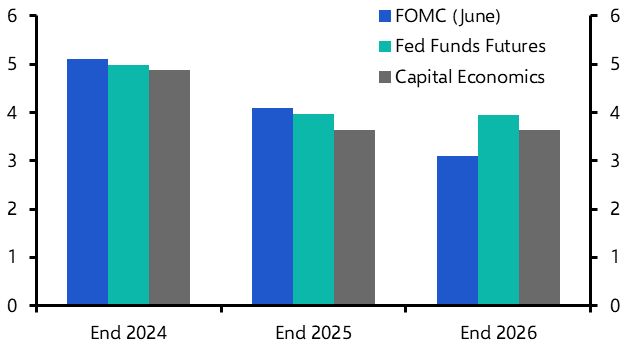
- With inflation normalising, we expect the Fed to cut interest rates by a cumulative 175bp, to a low of 3.50% to 3.75% late next year, with the first two of those cuts coming later this year. (See Chart 8.)
|
Chart 7: Federal Budget Balance (% of GDP) |
Chart 8: Fed Funds Rate Expectations (%) |
|
|
|
|
Sources: Refinitiv, Federal Reserve, CE |
- GDP growth should remain more muted this year, with consumption growth slowing, in response to weaker gains in real income and high interest rates, at the same time as the earlier booms in non-residential structures and government investment fade.
- Retail sales have been softer in recent months and even services consumption growth has slowed. Lacklustre real income growth in recent quarters means that any pandemic-era excess savings are now almost all spent, particularly for credit-constrained lower-income households. (See Charts 9 and 10.) At least falling interest rates should provide some relief to consumers from late this year onwards.
|
Chart 9: Real Consumption |
Chart 10: Real Personal Disposable Income |
|
|
|
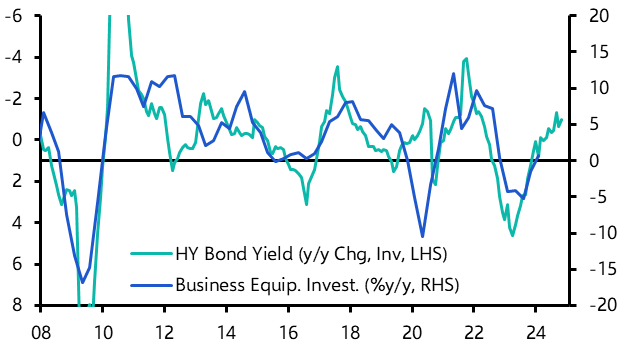
- In addition to providing a boost to durable goods consumption next year, lower long-term interest rates should benefit other rate-sensitive spending, such as business equipment investment and residential investment.
- The drop back in long-term interest rates we have already seen is fuelling a modest recovery in business equipment investment. (See Chart 11.) That said, with survey-based new orders indicators still weak, that recovery will be muted until next year.
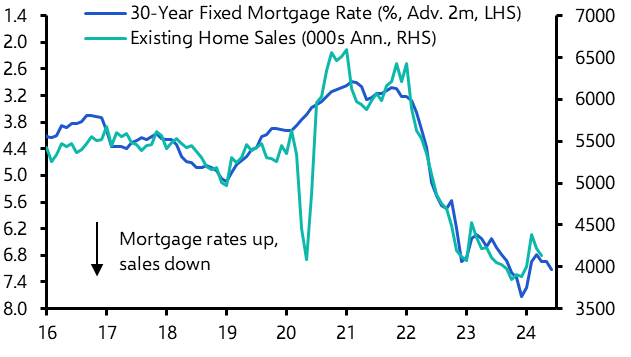
- Although lower mortgage rates will provide some boost to residential investment, it is likely to be a smaller one than in previous cycles. That’s because a decline in mortgage rates to even 6% would do little to persuade existing owners to list their homes for sale when they are locked into rates as low as 3%. Any recovery in home sales is likely to be unusually modest. (See Chart 12.)
|
Chart 11: Equipment Invest. & Non-IG Bond Yield |
Chart 12: Existing Home Sales & Mortgage Rate |
|
|
|
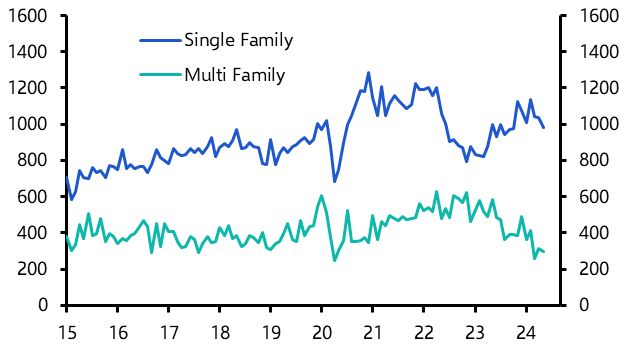
- Admittedly, the dearth of existing homes for sale has provided support for new home sales – and consequently single family housing starts too. (See Chart 13.) At the same time, however, the excess supply of apartments coming onto the market, particularly in the south, has already prompted a drop back in multifamily starts. That will weigh on multifamily investment this year.
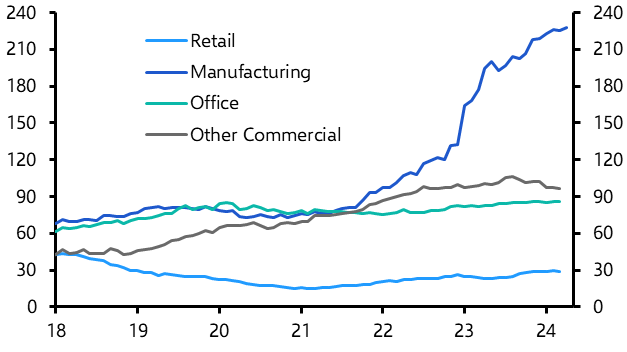
- Non-residential structures investment was another unexpected upside surprise last year, as construction of new hi-tech manufacturing plants surged, partly in response to the subsidies in the CHIPS Act and the IRA. (See Chart 14.) Despite a slump in capital values, investment in new offices and retail also held up well. The surge in manufacturing construction spending has begun to level out in recent months, however, and there is still a danger that investment in offices will eventually weaken.
|
Chart 13: Housing Starts (000s, Annualised) |
Chart 14: Construction Spending ($bn) |
|
|
|
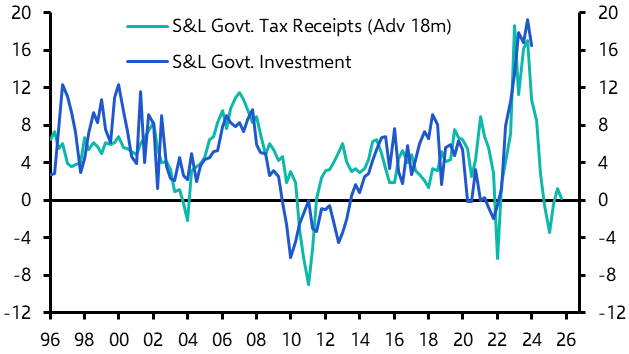
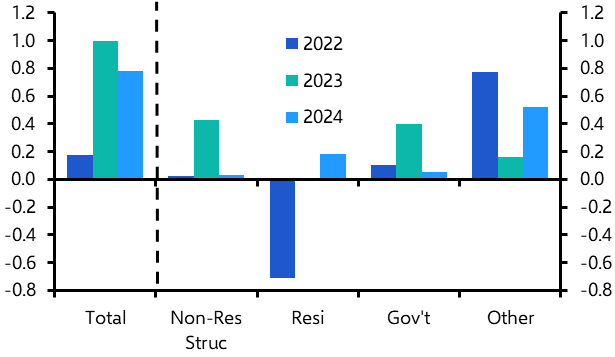
- After a 4.1% gain in 2023, we also expect a slowdown in government investment growth this year. That 2023 gain reflected the surge in state and local government tax revenues in 2022 which, because of balanced budget rules, took some time to feed through. (See Chart 15.) Revenues fell back in 2023, however, which will weigh on government expenditure this year – we expect growth to slow to 2.5% in 2024 and 1.1% in 2025.
- All things considered, even allowing for a pick-up in intellectual property and business equipment investment this year, we expect total fixed investment to make a smaller contribution to GDP growth than last year, as the earlier boosts to government and non-residential structures investment fade, while residential investment growth remains muted. (See Chart 16.)
|
Chart 15: S&L Gov’t Receipts & Investment (%y/y) |
Chart 16: Investment Contrib’tns to GDP Growth (% Pts) |
|
|
|
|
Sources: Refinitiv, Capital Economics |
Capital Economics clients get the full analysis, including:
- Why we expect that the recent strength of non-farm payroll growth will ease to 125,000 per month, with the unemployment rate edging up to 4.2% by mid-2025, and how this will ensure that wage growth continues to slow to less than 4% soon.
- How the latest price data reinforce our conviction that inflation is heading back to 2%, although challenging near-term base effects mean that is unlikely to happen until early 2025. Warning: the Fed’s celebrations could prove short-lived if Donald Trump wins in November, as the touted import tariffs have the potential to boost prices, while restrictions on immigration risk upward pressure on wages.
- Why, with core PCE inflation on track to end the year at close to 2.5%, we expect the Fed to cut interest rates in September, with the fed funds rate falling to a low of 3.50% to 3.75% next year. The precarious federal debt position means that we don’t expect either presidential candidate to promise any additional large-scale stimulus, although both would seek to extend most of the original Trump tax cuts due to expire at end-2025.
This is a sample of the 13-page US Economic Outlook prepared for Capital Economics clients, published on 25th June 2024 and written by Paul Ashworth, Stephen Brown, Olivia Cross and Thomas Ryan.

Get the full report
Trial our services to see this complete 13-page analysis, our complete US macro insight and forecasts and much more