
Tariff uncertainty overshadows fundamental weakness
Commodities Outlook Q2 2025

While tariffs and geopolitics complicate the near-term outlook for many commodities, the backdrop generally remains one of weak fundamentals.
Capital Economics was named most accurate forecaster of commodities prices by FocusEconomics in their annual forecast accuracy awards. These key takeaways from our latest quarterly Commodities Outlook, originally published on 24th March, 2025, highlight just some of our award-winning analysis and forecasts. Access to the complete report, including extensive forecasts and comprehensive analysis, is available as part of a subscription to Capital Economics. Some of the forecasts contained within may have been changed since publication.
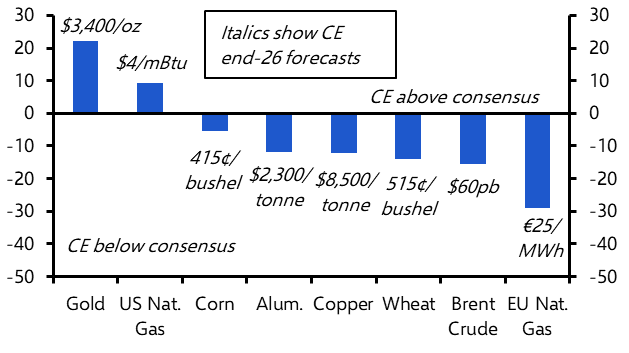
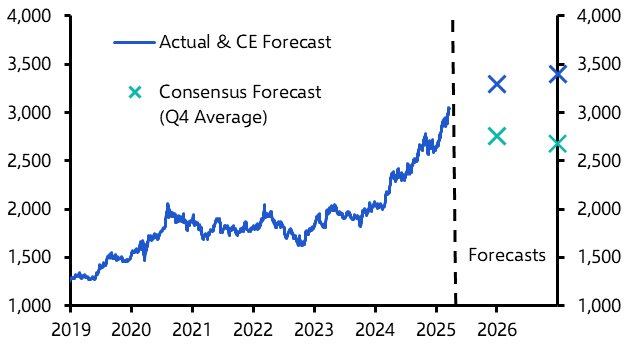
While tariffs and geopolitics complicate the near-term outlook for many commodities, the backdrop generally remains one of weak fundamentals; our end-2026 price forecasts for energy and industrial metals are well below consensus. (See Chart 1.) Gold is a notable exception, with rising demand from central banks and long-term investors set to push prices to fresh highs over the coming years. (See Chart 2.)
|
|
|
|
|
|
- Oil prices will find some support this year, not least if our view for the US economy to avoid a recession proves accurate. Meanwhile, even allowing for a gradual increase in supply from OPEC+, the oil market will be roughly in balance for much of 2025. (See Chart 3.) Against this backdrop, we expect oil prices to fluctuate between $75pb and our end-2025 forecast level of $70pb over the rest of the year.
- That said, the fundamentals in the oil market will weaken from 2026, not least as structural headwinds to demand in China strengthen. More generally, there is a non-negligible risk that cohesion within OPEC+ disintegrates and that the lowest-cost producers decide it is in their long-term interests to ramp up output to regain market share. All told, our forecasts for Brent crude to fall to $60pb and $50pb by end-2026 and end-2027 are well below the consensus, and the risks to these are arguably skewed to the downside.
- The impending wall of LNG supply from the US and Qatar – which will increase global LNG exports by around 35% over the coming years – overshadows the near-term outlook for gas markets. This will weigh on natural gas prices in Europe and push prices up in the US. Nonetheless, natural gas prices in the EU will remain 2-3 times those in the US. (See Chart 4.)
|
Chart 3: Global Oil Market Balance & Brent Crude Price |
Chart 4: European and US Natural Gas Prices (End-Quarter) |
|
|
|


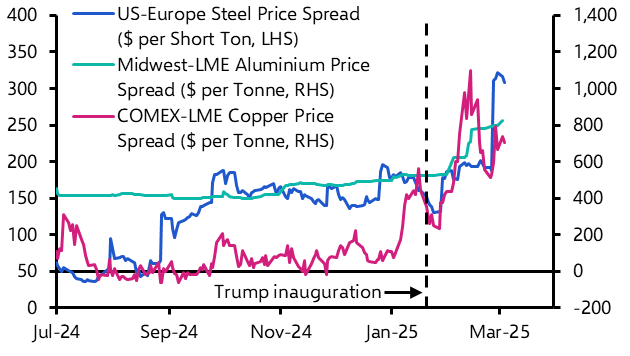
- The imposition of US tariffs on steel and aluminium – and the prospect of such tariffs being extended to copper – has caused benchmark prices of industrial metals in the US to surge. (See Chart 5.) There is scope for US steel producers to increase production, which should bring US steel prices down over time. But the differentials between US aluminium and copper prices and non-US benchmarks will remain elevated for longer.
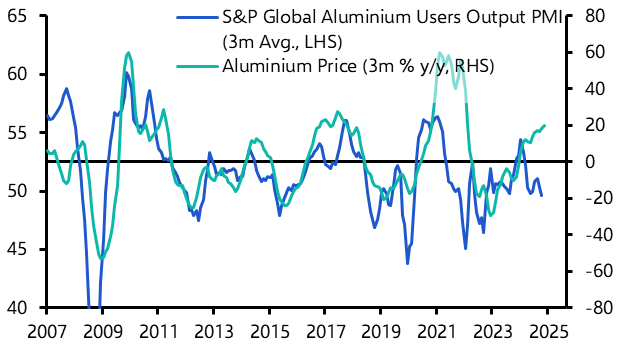
- Away from the US, global benchmark metals prices will be less affected. The increase in near-term support for the housing market announced in the National Peoples’ Congress in China will help to bolster weak demand in the near term. (See Chart 6.) Meanwhile, the prospect of higher defence spending in Europe will also probably be positive for metals prices in the near term. That said, policy measures will only slow the decline in China’s construction sector, which will remain a headwind for metals demand over the longer term. Meanwhile, abundant capacity in the country will continue to boost the supply of metals. Accordingly, although industrial metals prices will remain elevated by historical standards over the coming years, our forecasts for prices to fall are well below the consensus.
|
Chart 5: US Metals Prices Vs. Other Benchmarks |
Chart 6: S&P Global Aluminium Users PMI |
|
|
|
- Stronger gold demand from central banks and long-term investors will continue to offset the unfavourable movements in so-called “traditional” drivers. As a result, we forecast gold prices to continue to rise, despite our forecasts for further gains in the US dollar and Treasury yields, reaching $3,300 by end-2025 and $3,500 during our forecast horizon. (See Chart 7.)
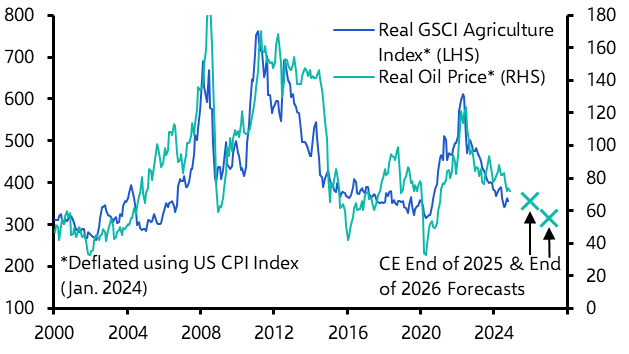
- Retaliatory tariffs could potentially reroute agricultural trade flows. But the bigger picture is that we expect most agricultural prices to fall over the coming years as supply continues to recover and oil prices decline. (See Chart 8.) Meanwhile, extreme weather and climate change-related effects will be a source of price volatility over the coming years.
|
|
|
|
|
|
|
Sources: LSEG, IEA, Eurostat, CEIC, AGSI+, Capital Economics |
Get the full Commodities Outlook report for the full analysis and extensive forecasts, including:
- Quarterly end-period and period-average forecasts to Q4 2027 covering a full range of hard and soft commodities.
- Why lower oil prices will cause a bigger headache for OPEC+.
- How a flood of LNG exports will narrow the divergence in gas prices
- Why base metals prices won’t defy gravity for much longer
- Tariff distortions will prove temporary for iron ore and steel prices
- How Gold and silver prices will shine over the coming years
- Why grain prices to fall as market fundamentals trump tariffs
These are just some of the key takeaways from a 15-page report published for Capital Economics clients on 24th March, 2025 and written by David Oxley, Kieran Tompkins, Olivia Cross, Hamad Hussain, Lily Millard and Jack Oatley.
Get the full report
Trial our services to see this complete 15-page analysis, our complete commodities insight and forecasts and much more