Q1 2025 US Economic Outlook
Trump policies will be mildly stagflationary

Although progress has stalled in recent months, we still expect core inflation to fall back to within touching distance of the Fed’s 2% target by early next year, aided by favourable base effects. Nonetheless, with the incoming Trump administration intent on imposing import tariffs relatively quickly, the return of core inflation to close to 2% will likely prove short-lived.
This is a sample of our latest quarterly US Economic Outlook, originally published on 19th December 2024. Some of the forecasts contained within may have changed since publication. Access to the complete report, including extensive forecasts, near to long-term analysis and interactive data resources, is available as part of our subscription services.
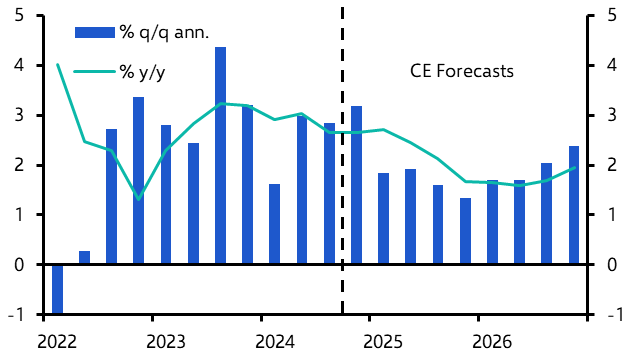
We expect the incoming Trump administration’s policies to have a mildly stagflationary impact on the economy. Assuming that Trump introduces tariffs and immigration curbs via executive action by the middle of next year, we would expect GDP growth to run close to 1.5% at an annualised pace over the following 12 months (see Chart 1), with inflation temporarily rebounding to around 3%.
- Despite the Republican clean sweep in the election, we suspect that the risk of an adverse market reaction will prevent any significant deficit-financed fiscal stimulus. (See here.) With Republicans holding only wafer-thin majorities in both houses of Congress, the remaining deficit hawks will also have plenty of leverage to rein in fiscal policy.
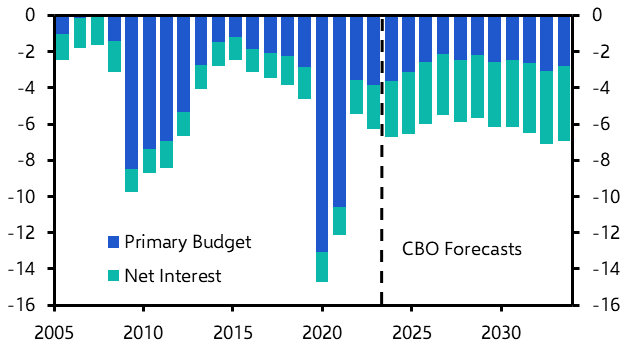
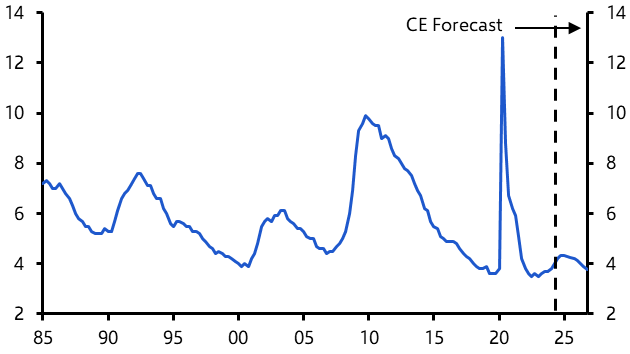
- We do expect an extension of the original Trump tax cuts, which are due to expire at the end of next year, but that only prevents a fiscal tightening. The CBO projects that even if those tax cuts were allowed to expire, the Federal deficit would remain close to 6% of GDP, with the debt burden headed toward 120% of GDP. (See Chart 2.) Extending the expiring tax cuts would cost an additional $4.5trn over the next decade, pushing the debt burden to 130% by the mid-2030s. Adding additional stimulus on top of that would be a very foolhardy step.
|
Chart 1: Real GDP |
Chart 2: Federal Budget Balance (% of GDP) |
|
|
|
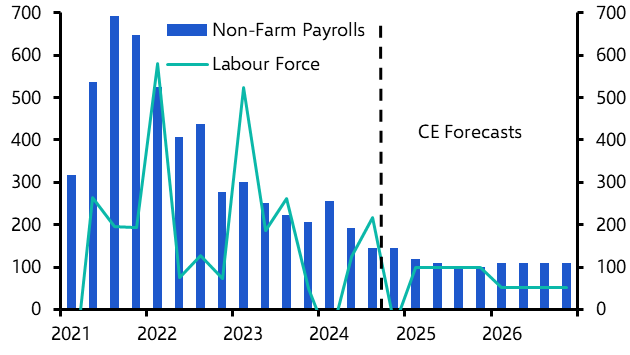
- Incoming immigration has already slowed after President Biden’s executive action in June limited asylum claims. Assuming that president-elect Donald Trump introduces further curbs, we expect labour force growth to slow to a crawl. (See Chart 3 and here.) In that scenario, we see the unemployment rate falling back, even with monthly employment gains averaging close to 100,000. (See Chart 4.)
|
Chart 3: Change in Employment & Labour Force (Monthly Ave, 000s) |
Chart 4: Unemployment Rate (%) |
|
|
|
- We assume that Trump will impose a 10% universal tariff via executive action in the second quarter of next year, with a 60% tariff on China’s imports. (See here.) We see the universal tariff as a semi-permanent measure, designed to generate new tax revenues.
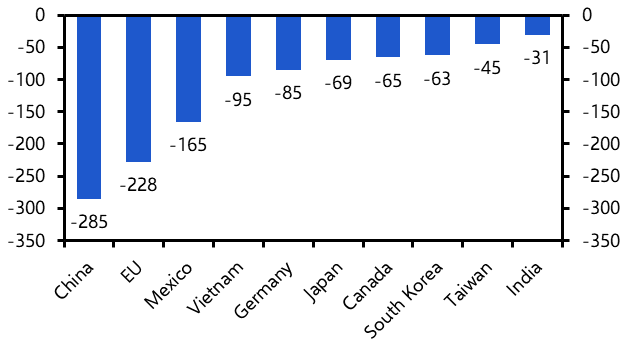
- Nevertheless, as we have already seen with his attempts to bully Canada and Mexico, Trump will also threaten even higher tariffs, as a bargaining tool to extract concessions from other countries. Any other country running a large bilateral trade imbalance with the US – whether friend or foe – has a good chance of being targeted at some point in the next four years. (See Chart 5.)
- Although curbing immigration will hit both aggregate demand and supply, we would expect the net impact to be slightly inflationary. Low-income unauthorised immigrants don’t add much to aggregate consumption, but their labour would be sorely missed in certain sectors – like agriculture, construction and food processing.
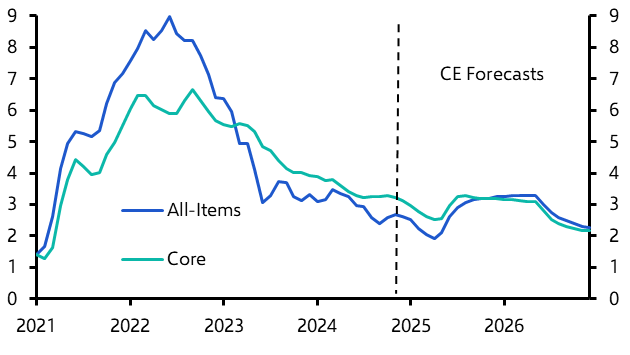
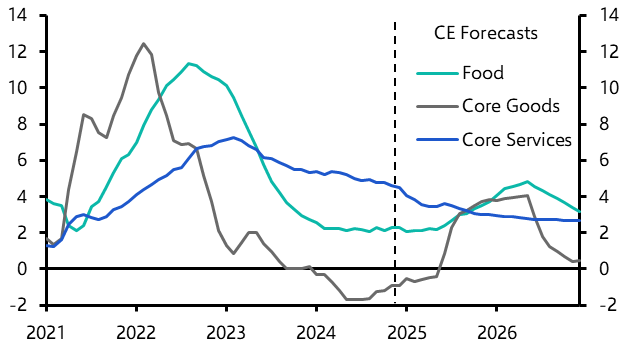
- Since there is less scope for re-routing and only limited offset via a dollar appreciation, we expect the tariffs to temporarily boost core goods inflation. New tariffs introduce a one-off step change in the price level, however, rather than providing an ongoing boost to the inflation rate, which should drop back from mid-2026 onwards. (See Charts 6 & 7.)
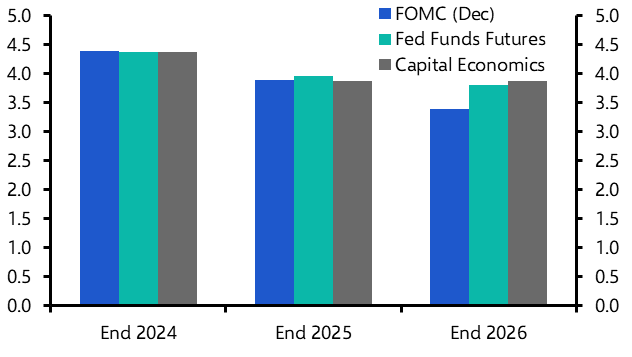
- Under those circumstances, we expect the Fed to stop cutting rates next June – with the fed funds rate at a still-above neutral 3.75% to 4.00%, but don’t anticipate renewed rate hikes. (See Chart 8.)
|
Chart 5: US Bilateral Trade Balance ($bn, Latest 12m) |
Chart 6: CPI Inflation (%) |
|
|
|
|
Chart 7: CPI Inflation (%) |
Chart 8: Fed Funds Rate Expectations (%) |
|
|
|
|
Sources: LSEG, Federal Reserve, CBO, CE |
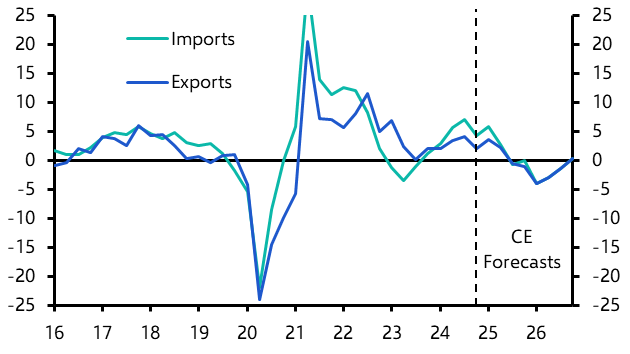
Tariffs will be only a modest drag on GDP growth, with imports and exports both falling by roughly 5% from mid-2025 onwards. (See Chart 9.) Admittedly, under some circumstances tariffs might even be a net positive for the real economy. But with the economy already operating at close to full capacity, there is only limited scope to boost domestic goods production, particularly in the short-term.
- In an attempt to ease tensions, other countries might also refrain from retaliating with full matching countervailing tariffs. Once we factor in the impact of the dollar’s likely appreciation too, however, we suspect the impact on exports and imports will be very similar.
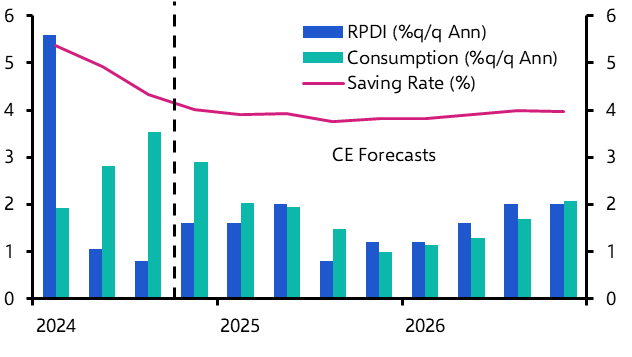
- Rising prices, in part due to tariffs, and immigration curbs will together weigh on real incomes and, consequently, consumption growth too, particularly with little scope to drive the saving rate even lower. (See Chart 10.) Knowing that tariffs are coming, households may try to front run them, boosting first-quarter consumption. The associated surge in imports would be a negative for GDP, however, meaning there would be no impact on the latter.
|
Chart 9: Real Exports & Imports (%y/y) |
Chart 10: Real Consumption, Income & Saving |
|
|
|
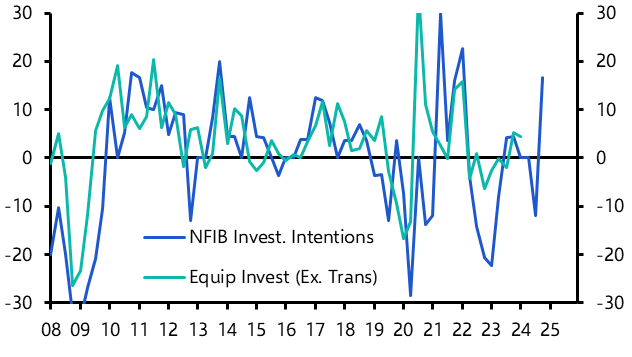
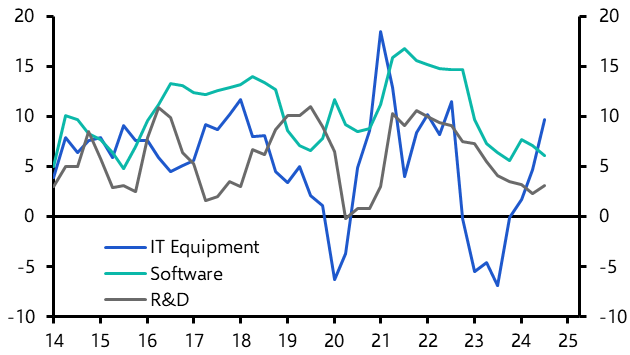
- There weren’t any obvious signs that pre-election uncertainty was weighing on business investment, but the post-election surge in small business confidence suggests that we could see a pick-up in the first half of next year. (See Chart 11.) The AI boom should also translate into stronger investment growth in IT hardware, software and R&D. (See Chart 12.) With borrowing costs now likely to remain a little higher than we previously anticipated, however, we expect business investment growth to be solid rather than spectacular.
|
Chart 11: Equipment Investment & Intentions (%y/y) |
Chart 12: Selected Business Investment (%y/y) |
|
|
|
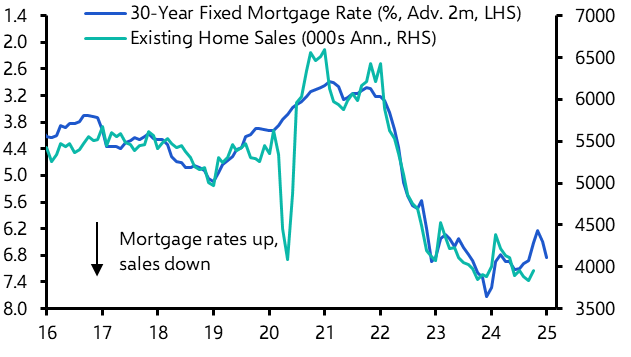
- A more muted decline in mortgage rates means that we are less optimistic about the scope for a rally in existing home sales too. (See Chart 13.) The ongoing lack of supply of existing homes to buy will continue to boost new home sales, supporting single-family home construction. Unfortunately, a drop off in multifamily construction means that we don’t expect any meaningful recovery in residential investment until 2026.
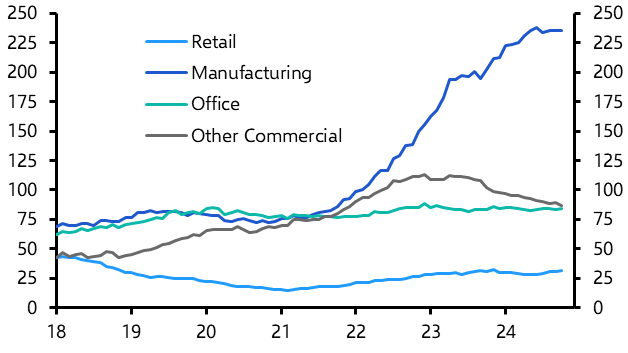
- The post-Inflation Reduction and CHIPS Acts boom in the construction of new hi-tech manufacturing plants appears to have run out of steam. (See Chart 14.) With the other components of non-residential construction spending broadly flat, we expect structures investment to drop back a little in 2025.
|
Chart 13: Existing Home Sales & Mortgage Rate |
Chart 14: Construction Spending ($bn) |
|
|
|
- The Trump administration will seek to boost domestic oil & gas production via deregulation. But opening up federal lands to more drilling will have a modest impact, since it accounts for only a minor share of output. With technological advances in horizontal drilling techniques meaning that oil production has been increasing without any associated increase in drilling, we don’t anticipate any big surge in mining structures investment. (See Chart 15.)
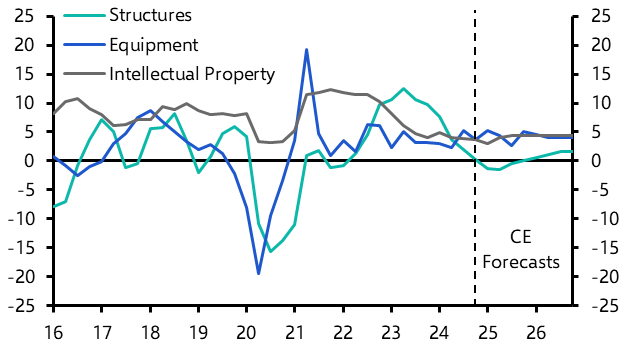
- Overall, we are forecasting that business investment growth will be 3.3% in 2025 and 3.8% in 2026, with intellectual property and equipment investment growing at around 4% in both years, while non-residential structures investment is expected to fall by 0.8% next year before rebounding by 1.2% in 2026. (See Chart 16.)
|
Chart 15: Crude Oil Production & Drilling Rig Count |
Chart 16: Business Investment (%y/y) |
|
|
|
|
Sources: LSEG, Capital Economics |

Capital Economics clients get the full analysis, including:
- Why we expect the downward trend in employment growth to continue as the economy slows over the coming quarters, weighing on wage growth.
- Why we think core inflation will fall back to within touching distance of the Fed’s 2% target by early next year, aided by favourable base effects, even though progress has stalled in recent months. But also why, with the incoming Trump administration intent on imposing import tariffs relatively quickly, the return of core inflation to close to 2% will likely prove short-lived.
- Why we are sceptical that a Republican clean sweep opens the door to additional fiscal stimulus.
This is a sample of the 13-page US Economic Outlook prepared for Capital Economics clients, published on 19th December 2024 and written by Paul Ashworth, Stephen Brown, Thomas Ryan, Bradley Saunders and Ruben Abargues.
Get the full report
Trial our services to see this complete 13-page analysis, our complete US macro insight and forecasts and much more