‘Chart of the week’ has to go to our China team, whose effort below was a centrepiece of discussions in our latest client roundtables. It shows exports from China to the US, Europe and the rest of the world up to May. (See Chart 1.) Two key shifts stand out on the right hand side. The first is the collapse in Chinese exports to the US, which in May were 37% lower than at the start of the year. The second is the increase in exports to Europe and the rest of the world, both of which are up by over 10% since the start of this year.
|
Chart 1: China Exports (Values, SA, 2017 = 100)
Sources: LSEG, Capital Economics |
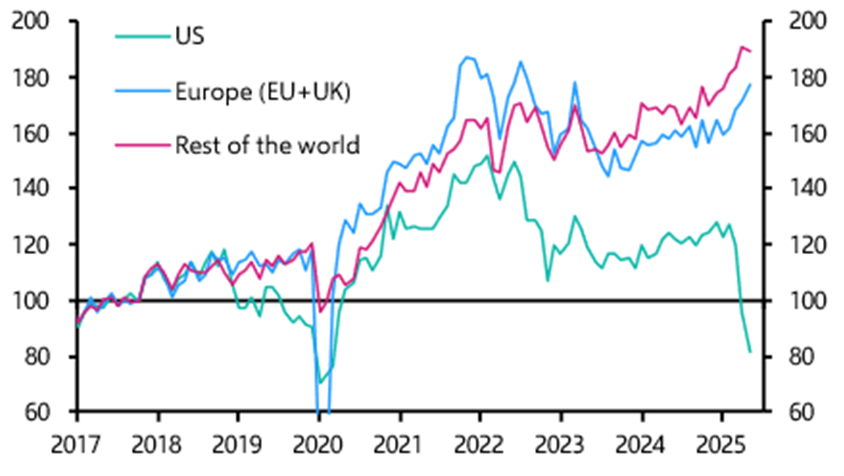
Tariffs are clearly playing a role here. Shipping lags and other factors mean import and export data don’t align perfectly from month to month. Nonetheless, it's clear that US imports spiked in March as firms moved to front-run incoming tariffs, only to collapse in April and May. This was the then-peak of the US-China tariff war and the subsequent deal to reduce tariffs that was agreed in mid-May means a rebound in imports from China is possible in the coming months. At the same time, imports to Europe and other major economies have increased at a steady rate (consistent with the China export data) and our Global Trade Stress Monitor does not suggest there has been major dislocation in the world trade system. On that basis, some of the divergence in trade flows shown in Chart 1 should narrow.
But the chart raises profound questions about the future of global trade. While the eye is drawn to the steep fall in exports to the US in recent months, the big picture is that exports from China have almost doubled since 2018. This is the logical consequence of a growth model that favours saving and investment over consumption. As productive capacity has expanded, the weakness of domestic demand has meant that firms have exported their excess output. This is not necessarily a major problem if it is being done by a small- or medium-sized economy. But when the world’s second largest economy is churning out goods for export at these volumes, it becomes difficult for others to absorb their sheer scale. This challenge is only compounded when the world’s biggest economy erects trade barriers to try to keep those goods out.
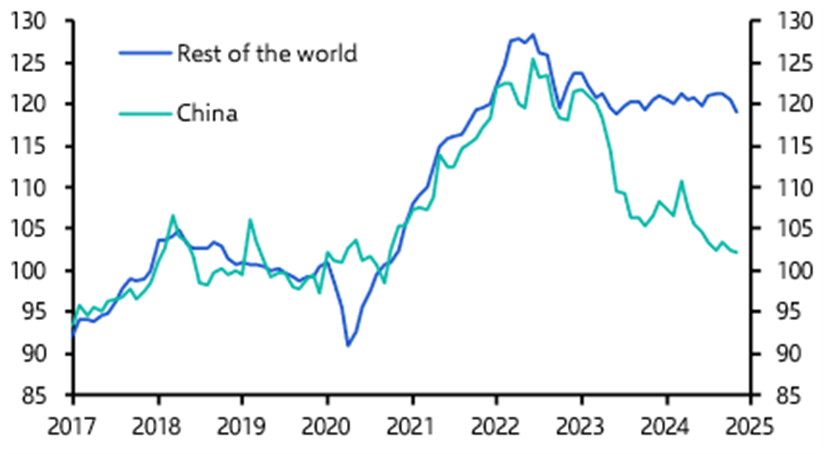
Three implications stand out from this. The first is that an expansion of capacity against a backdrop of weak domestic demand is forcing Chinese exporters to cut prices and squeeze margins to shift volume. Chinese export prices have fallen by 20% since 2022, and are likely to remain on a downward trajectory. (See Chart 2.) Despite persistent claims to the contrary, China remains a source of disinflation for the global economy.
|
Chart 2: Goods Export Prices (2019 =100)
Sources: LSEG, Capital Economics |
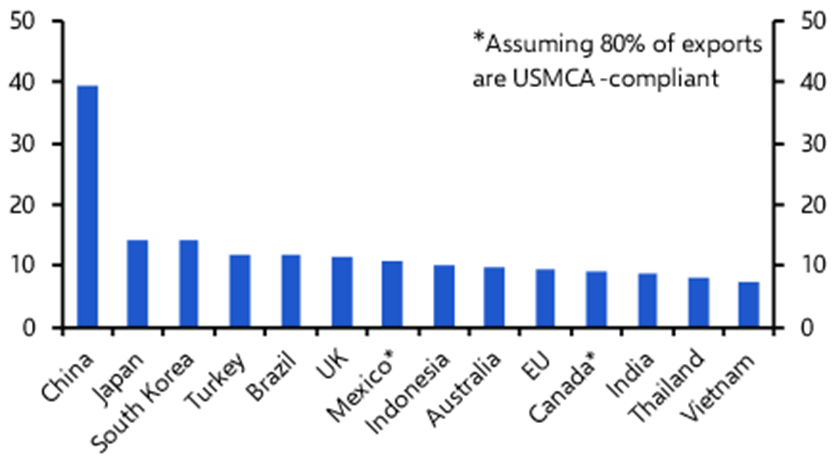
Second, despite the bilateral deal that was struck last month in Geneva, US tariffs on China remain much higher than on other countries. (See Chart 3.) This is likely to remain the case in the long term, and will create a powerful incentive for Chinese firms to reroute shipments to the US through third countries. US policymakers may eventually tackle these “transhipment” activities by tightening rules of origin requirements in trade deals. But this is a process that will take years to complete. For the time being, a differentiated system of tariffs is likely to lead to significant rerouting of trade.
|
Chart 3: Effective Tariff Rate by Country (%)
Sources: The White House, Capital Economics |
Finally, the persistence of US tariffs alongside the continued weakness of domestic demand in China, is likely to cause Chinese producers to seek new markets in other countries. The counterpart to this is that major economies – Europe, Japan, Canada, India and other large EMs – are likely to face a flood of imports from China. This is already causing concern in some capitals. Europe, in particular, is pushing back against imports of cars from China.
A combination of transhipment and efforts by China to seek new markets in other countries should mean that global trade volumes hold up relatively well in the face of Trump’s tariffs over the next year or so. But China’s export dominance risks provoking a broad backlash in other countries, exacerbating already febrile tensions in the global trading system and fuelling another wave of protectionism.
Trump’s tariffs may be the focus of attention but, like so much in the global trading system, its underlying strains are Made in China.
In case you missed it:
Chinese manufacturers may be taking action to sidestep Trump’s tariffs, but our latest China Outlook outlines the drivers of a broad slowdown in the export engine that has done so much to support the country’s recent growth.
Our real estate team launched formal coverage of Asia-Pacific markets last week and will be briefing on the key takeaways of their inaugural Outlook in a Drop-In this coming Thursday. Register here for that session.
Our Trade Hub remains the go-to for understanding how Trump’s tariffs are influencing the global macro outlook. From trade cycle impacts to our proprietary tariff model, this data is available for Capital Economics clients to explore and download.