- This Update answers the questions on the Iran war and the impact on emerging markets that we have received most frequently from clients in meetings, through our platform and in our online briefings (watch on demand here). The war will lead to sharp falls in GDP in the Gulf economies and weigh on energy importers, particularly in Asia. Inflation has ticked up on the back of the energy shock and further increases lie in store. Few EM central banks will have room to cut interest rates this year. But by the same token, most are likely to be able to refrain from hiking.
- Where are growth prospects taking the biggest hit? Gulf economies are of course the worst-affected by the conflict. The closure of the Strait of Hormuz has forced oil wells to shut which, alongside damage to energy infrastructure, means that it will take time for output to return to pre-war levels. Non-oil activity will suffer too, particularly in those parts of the economy most reliant on tourists or footfall.
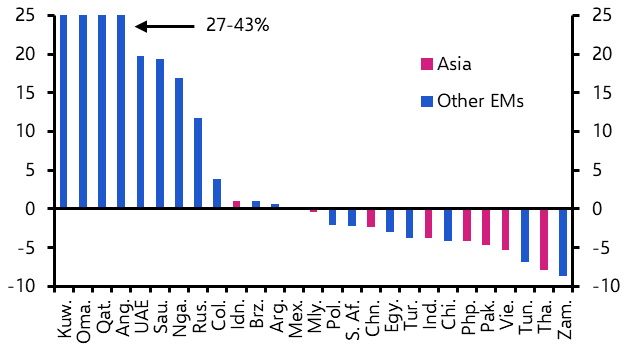
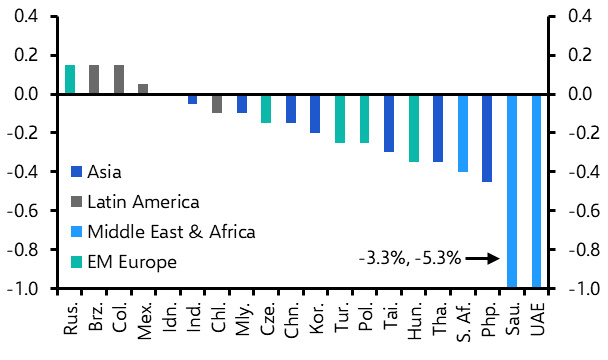
- Falls in GDP ranging from 2% (Oman) to 13% (Qatar) are likely this year. Outside of the Gulf, Asia’s heavy reliance on imported energy (see Chart 1) – particularly shipments passing through the Strait of Hormuz – means the region is more exposed than most. As a result, our 2026 GDP downgrades are larger across much of Asia than elsewhere. (See Chart 2 and our Global Economic Outlook for a full set of forecasts.)
- Which EMs are profiting from the conflict? Russia is one of the main beneficiaries. Higher oil prices will raise government energy tax revenues by an additional 1.0% of GDP this year relative to our pre-war forecast. With most of this windfall likely to be saved, though, the boost to GDP will be limited.
- The surge in energy prices will also lift incomes in Angola and Nigeria but, unlike in Russia, persistent spending pressures mean that much of the windfall is likely to be spent, leading to a bigger GDP boost. Latin America as a whole is a net beneficiary from higher energy prices, but the terms of trade boost is limited by a lack of domestic refining capacity.
- How will the energy shock impact the inflation and monetary policy outlook? The available CPI figures for March show that, on the whole, the energy price shock has had a relatively limited impact on EM inflation so far. In part, that’s because of energy subsidies, particularly in Asia. But it also reflects weakness in broader price pressures. As things stand, the data support the case that, in our baseline scenario, most EM central banks will opt for an extended pause, rather than interest rate hikes.
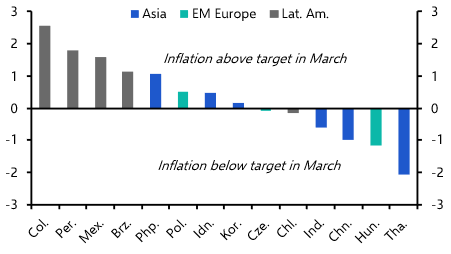
- That said, this is only an early snapshot and inflation is still likely to rise as the indirect effects of higher energy prices start to materialise. And there are a few areas of concern – particularly in parts of Latin America as well as the Philippines where inflation is already above central banks’ targets. (See Chart 3.) Colombia and the Philippines have hiked interest rates and others may follow if the war turns into something more adverse.
- Where might energy subsidy bills worsen fiscal strains? Many EM governments shield their populations from swings in global energy markets by subsidising local fuel prices. As we noted here, those governments with the largest subsidy bills also tend to be energy producers that will also benefit from offsetting higher revenues. But a handful of net energy importers also have sizeable subsidy bills and weak fiscal positions. Tunisia stands out. Energy subsidies are large (equal to 5% of GDP) and we’ve warned for some time that its public finances are on an unsustainable trajectory. The conflict and energy shock reinforce our view that Tunisia could be heading for a sovereign default.
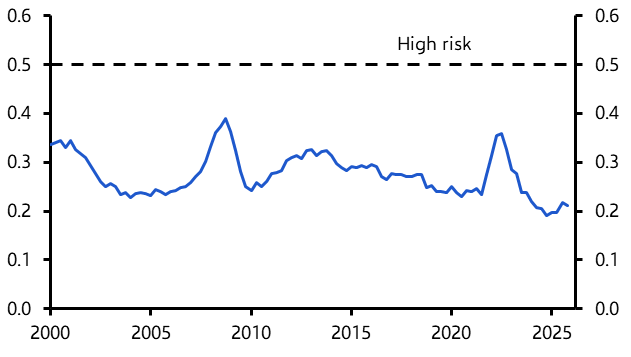
- Does the energy shock raise external risks for EMs? The energy price shock will of course worsen the current account positions of net-energy importing EMs. But unlike other recent energy shocks such as the start of the Ukraine war, the external balance sheets of most EMs are starting from a position of strength, limiting the risk of large currency adjustments. Indeed, our proprietary EM currency risk indicator is near its lowest level in the past two decades. (See Chart 4.) That said, there are pockets of vulnerability. This includes Turkey, Egypt, Zambia and Uganda. Romania, Tunisia, Ethiopia and Sri Lanka are vulnerable, but less so.
- Which EMs might suffer from a fall in remittances from the Gulf? Migrants make up around 50% of the Gulf’s workforce, so it is likely that worsening economic prospects in the region will weigh on demand for migrant workers, particularly those employed in oil/gas-related sectors or in leisure and tourism. Lebanon and Nepal stand out as the two most exposed countries. Remittances from the Gulf stand at around 10% of GDP, providing a vital source of external financing. Among larger EMs, a fall in remittances would exacerbate external strains in Egypt and Sri Lanka. The Philippines and Pakistan have stronger external positions but falling remittances could still put pressure on currencies and further shift the balance of probabilities towards monetary tightening.
- Which EMs will be most affected by surging fertiliser prices? The main impact of the rise in fertiliser prices on the global economy will come via higher food inflation. The macroeconomic repercussions will be significant in some lower-income EMs, particularly in Africa and South Asia, due to the larger size of their agricultural sectors, the importance of food in their CPI baskets and the risk of balance of payments strains. Egypt, India, Indonesia and Bangladesh appear to be the most likely candidates to ramp up support to contain price pressures, but that would come at a fiscal cost. (See our forthcoming Update for more.)
- As alternatives to oil and natural gas, are EMs more likely to adopt green energy or focus on other sources? EM policymakers are likely to do whatever is quickest and cheapest to reduce reliance on high oil prices and limit economic disruption. Historically, that would usually mean turning to other fossil fuels, such as coal. There has been evidence of this in some places, particularly in coal producers such as Indonesia and India. However, there is early evidence of the energy shock boosting demand for China’s green tech exports, which includes solar cells and lithium batteries. One particular example is Pakistan, where imports of Chinese solar panels surged in March after falling sharply at the end of last year.
|
|
|
|
|
|
|
|
|
|
|
|
|
Sources: LSEG, Capital Economics |