- While euro-zone equities face some meaningful short-term headwinds which threaten their recent run of outperformance, we still expect them to fare better than US equities over the next couple of years.
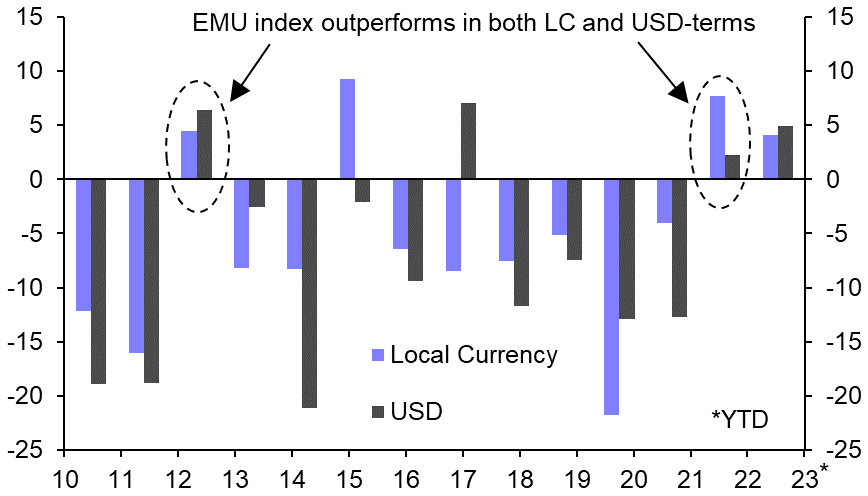
- Euro-zone equities broke a long run of underperformance last year, with the returns from MSCI’s EMU Index outstripping those from its MSCI USA Index in both local- and common-currency terms for the first calendar year since 2012. This outperformance has continued into early 2023. (See Chart 1.) The relative resilience of euro-zone equities over the past year or so is all the more remarkable given that it has taken place despite Russia’s invasion of Ukraine, Europe’s subsequent energy crisis, and – until relatively recently – a broad-based appreciation in the US dollar that had heaped yet more pressure on the euro.
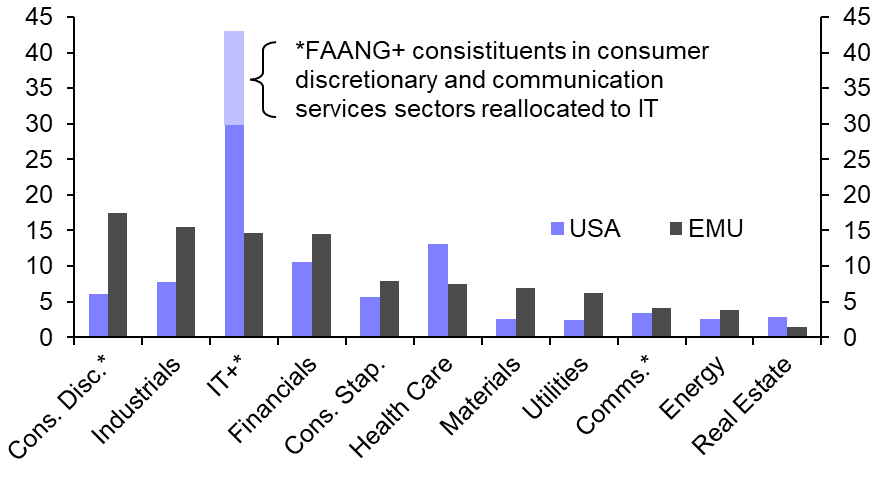
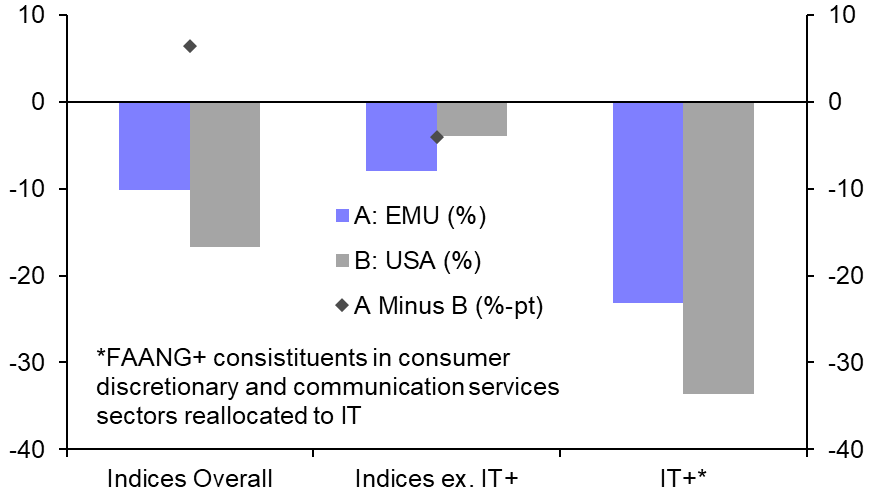
- This is partly due to the struggles of technology stocks. The information technology (IT) sector had a weight of ~30% in the MSCI USA Index at end-2021, compared to ~15% in the EMU Index. But that arguably understates the importance of technology to the US market, given some of the largest US firms often thought of as “tech” reside in the consumer discretionary and communication services GICS sectors. If we reallocate the five constituents of the FAANG+ Index which are part of those latter two sectors into an expanded “IT+” sector, technology’s end-2021 weight in the USA Index rises to ~43%. (See Chart 2.) After accounting for the plunge in the IT+ sector, euro-zone stocks have underperformed slightly in USD terms (see Chart 3) and outperformed only marginally in local-currency terms. Even so, tech is far from the only part of this story.
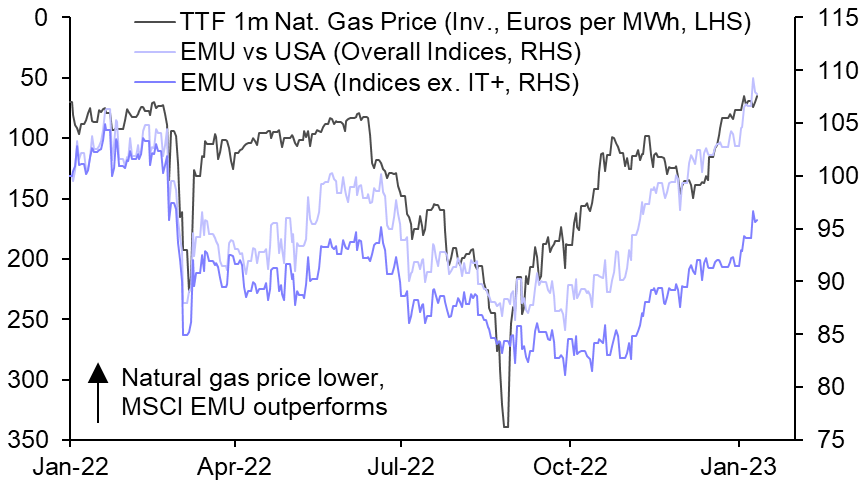
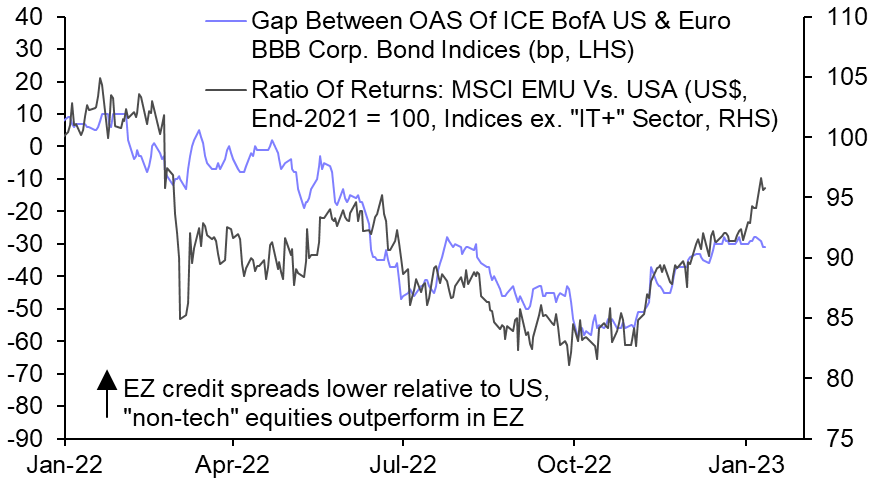
- The outperformance of euro-zone equities has also been driven by a host of positive macroeconomic developments more recently. Foremost is the marked easing in Europe’s energy crisis, as unseasonably mild weather has allowed the continent to maintain high stocks of natural gas for the time of year, leading to a sharp fall in prices. That retreat has reduced the upward pressure on inflation and interest rates and eased the downward pressure of real incomes and activity. Recent economic data showing that the euro-zone economy has been more resilient than most had expected have probably reassured investors too. These developments have been accompanied by both a marked outperformance from the MSCI EMU Index and a larger drop in high-yield credit spreads in the currency bloc than in the US. (See Charts 4 & 5.)
- Meanwhile, China’s abrupt reopening seems to have boosted the medium-term prospects for the global economy and the euro-zone’s exporters. Coming alongside signs that US inflation has peaked and building expectations for a Fed “pivot”, the improved global outlook has also led the US dollar to fall considerably from its late-September highs, supporting returns from euro-zone equities in common-currency terms.
- We think that euro-zone equities face some meaningful headwinds in the near term. Notwithstanding the easing in the energy crisis, the euro-zone has still experienced a significant terms of trade shock, which we expect to continue to weigh on activity. Meanwhile, we suspect that the lagged impact of earlier monetary tightening will tip the global economy into recession over the coming months. That influences our view that stock markets generally will struggle over the next quarter or two, and that safe-haven inflows will lead to a renewed rise in the US dollar versus most other currencies, including the euro. Against that backdrop, it might be hard for euro-zone equities to continue to outperform, at least in common-currency terms.
- Even so, we suspect that the outlook for “risky” assets will become much brighter from around the spring of this year, as the global economy eventually shows signs of turning a corner. From that point, we think that euro-zone equities could be fairly well placed to resume their outperformance of those in the US.
- We would not be surprised to see some further underperformance from the technology stocks that still account for a large share of the US market. While they have been pared back more recently, analysts’ expectations for earnings for the IT, consumer discretionary and communication services sectors still seem quite rosy to us, and high starting points for margins suggest ample room for disappointment. And in some cases valuations still seem a bit stretched, despite corrections over the past year or so.
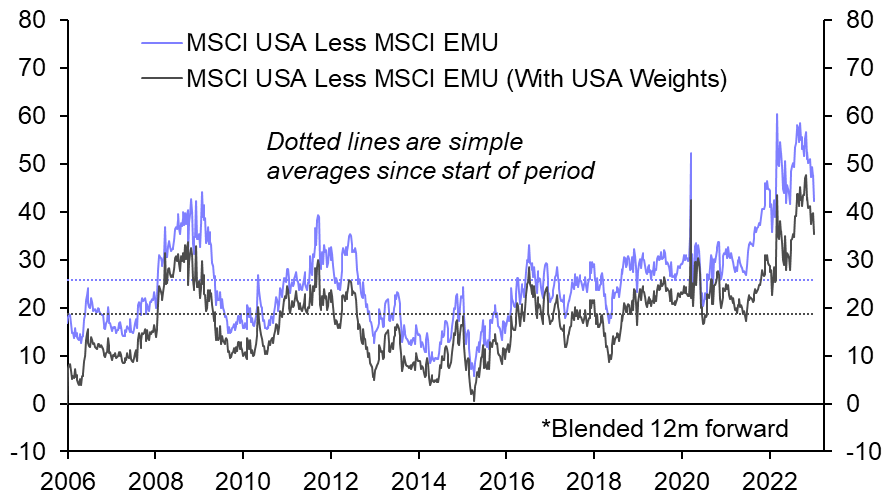
- What’s more, even after the recent rally, and after accounting for differences in sector composition, the valuation of the MSCI EMU Index is still low compared to that of the MSCI USA Index. (See Chart 6.)
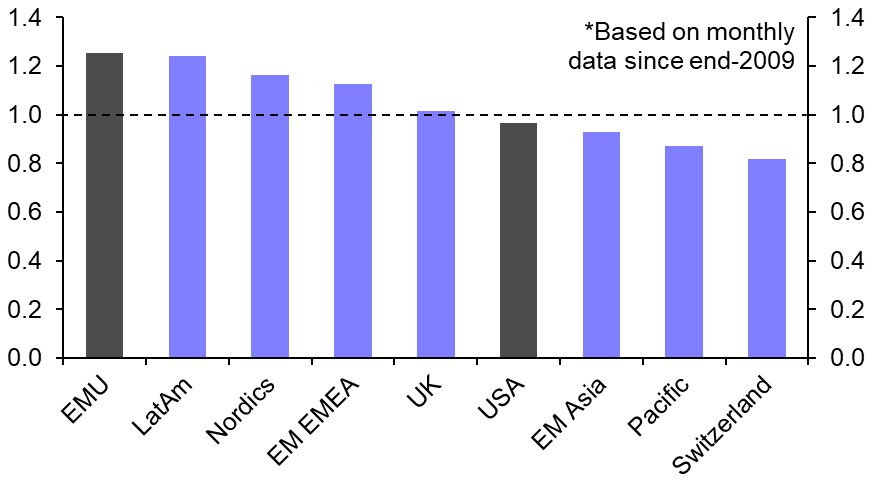
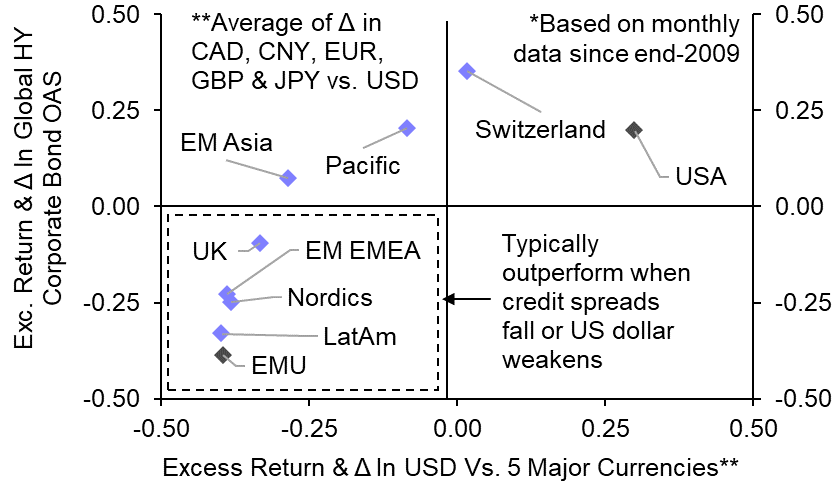
- Euro-zone equities also typically fare well in the type of macroeconomic environment that we envisage taking hold eventually – broad-based rallies in risky assets and the US dollar retreating in anticipation of an upturn in the global economy. The “beta” of the MSCI EMU Index to MSCI’s ACWI Index is relatively high, implying that euro-zone equities have typically outperformed when global stock markets have rallied. (See Chart 7.) That might reflect the relatively large weight that the “cyclical” consumer discretionary, industrials and financial sectors have in the EMU Index. Chart 8 also provides some support for the idea that euro-zone equities might outperform amid a global upswing, given the strong negative correlation between excess returns from the MSCI EMU Index and changes in the credit spreads of global high-yield corporate bonds, as well as and the strong negative correlation between excess returns and the US dollar.
|
Chart 1: Annual Total Returns From MSCI EMU Index Less MSCI USA Index (%-pt) |
Chart 2: “Adjusted” Sector Weights Of MSCI EMU and USA Indices At End-2021 (%) |
|
|
|
|
Chart 3: Total Returns From MSCI EMU & USA Indices Since End-2021 (US$, %) |
Chart 4: European Natural Gas Price & Ratio Of Returns Indices (US$, End-2021 = 100) |
|
|
|
|
Chart 5: US Less EZ HY Credit Spreads & Ratio Of Returns From “Non-Tech” Equities In EZ Vs. US |
Chart 6: Relative Price/Earnings Ratios* (%) |
|
|
|
|
Chart 7: “Betas” Of Selected MSCI Equity Indices Relative To MSCI ACWI Index (Based On US$ Returns) |
Chart 8: Correlation Between US$ Exc. Returns Relative To MSCI ACWI Index (US$) & Changes In 2 Variables* |
|
|
|
|
Sources: Refinitiv, Bloomberg, Capital Economics |
Oliver Allen, Senior Markets Economist, oliver.allen@capitaleconomics.com

Read more
Sign up for a free account today to unlock even more insight from our 70+ global team of economists.