- This Update makes four key points about corporate earnings in the US as the Q4 results season gets into swing. They all feed into our view that the S&P 500 will remain under pressure until the spring and underperform Treasuries as a recession there begins to take hold, but that it will then recover strongly and trump a continued decent showing from US government bonds to end 2023 above its level now.
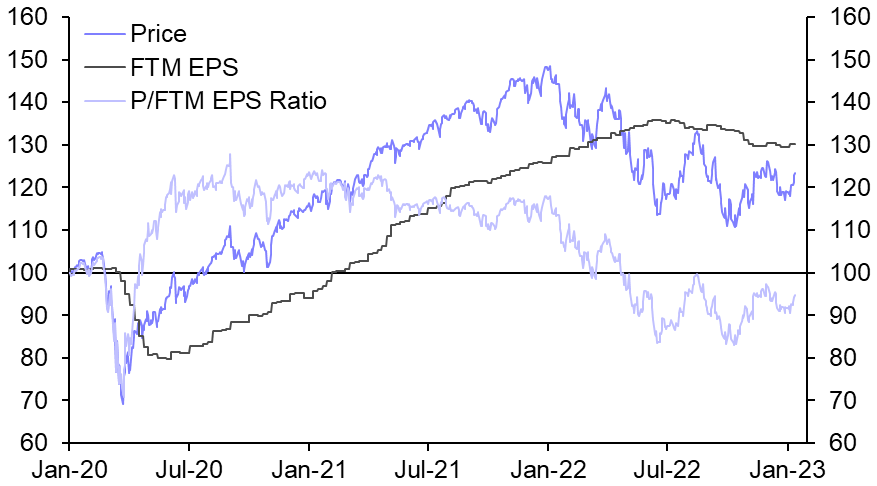
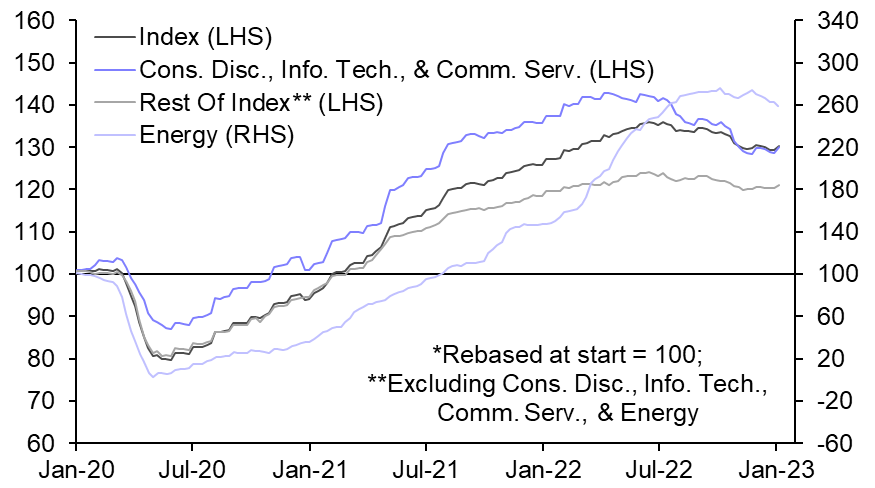
- Point 1: Although expectations for earnings have been pared back considerably, they remain above trend. A surge in S&P 500 forward 12m (FTM) earnings per share (EPS) drove the index up in 2021 and cushioned the blow from the big “de-rating” it experienced in H1 2022 as TIPS yields soared. Since then, though, FTM EPS have declined by about 4%, based on I/B/E/S survey data. (See Chart 1.) The pull-back has been more pronounced in a “supersector” containing the “growth-heavy”, “rate-sensitive” consumer discretionary, information technology, and communication services sectors. This supersector contains the big-tech behemoths which prospered in general during the pandemic. FTM EPS have also fallen on average to a lesser degree in other sectors. One sector that had bucked the trend until recently was energy. But FTM EPS in this sector have also finally rolled over in the wake of falling energy prices. (See Chart 2.)
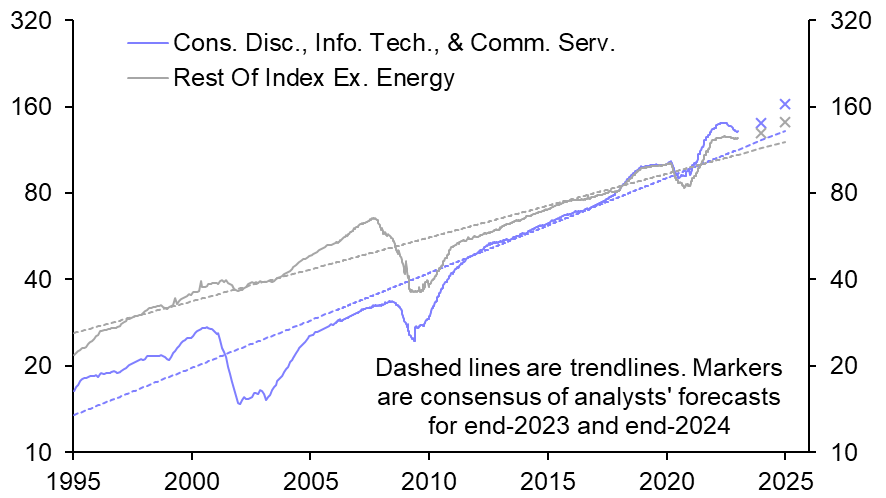
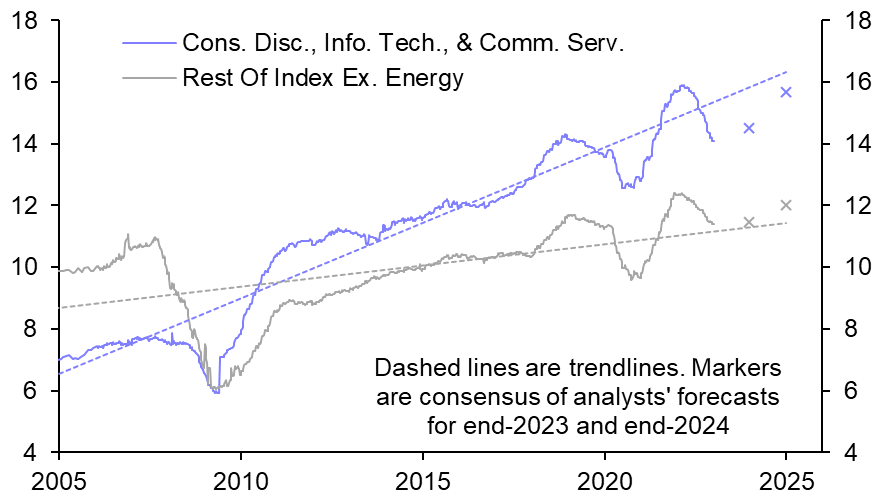
- FTM EPS excluding the volatile energy sector nonetheless typically remain much higher than their trend levels since early 1995, a situation which is expected by analysts to persist. (See Chart 3.) To some extent, this seems to reflect a view that margins will not continue to come back down despite rising significantly in recent years to very high levels. (See Chart 4.)
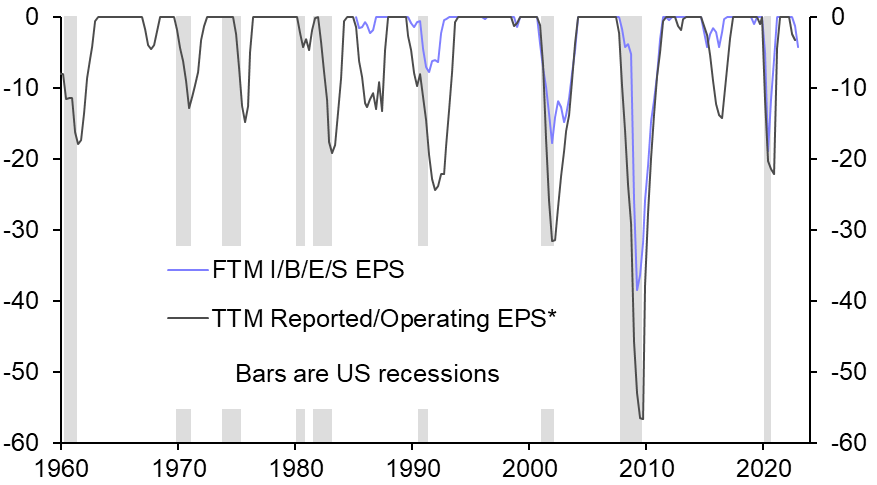
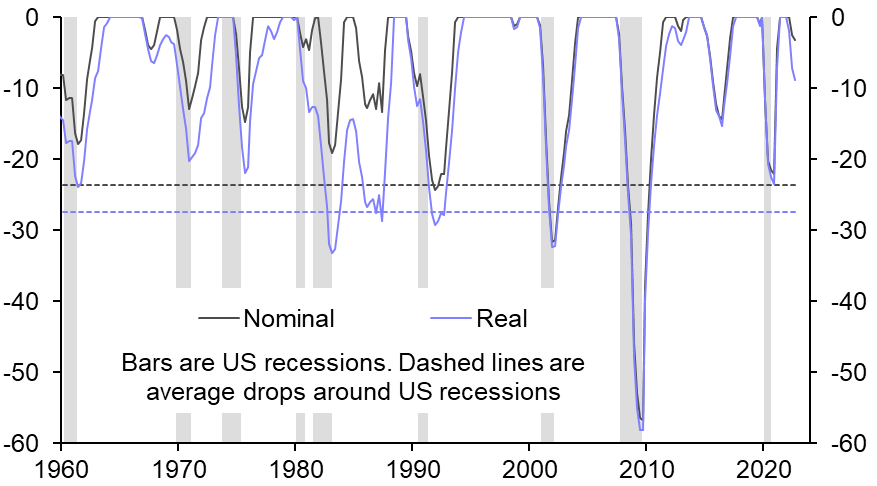
- Point 2: Current expectations for earnings seem inconsistent with even the mild US recession we envisage. Even though expectations for earnings are bound to be wide of the mark, there has tended to be a good relationship – at least directionally – between S&P 500 FTM EPS and trailing 12m (TTM) EPS. (See Chart 5.) With that in mind, the decline in TTM EPS since last year’s peak has also been small. Admittedly, it has been more than 10% after accounting for inflation, using a deflator for the non-financial corporate sector. But it has still been much less than the average drop of more than a quarter in real terms around recessions since 1960, based on a mix of reported (pre-Q4 1988) and operating data. (See Chart 6, which also reveals big gaps between drawdowns in nominal and real TTM EPS in the inflationary early 1980s.)
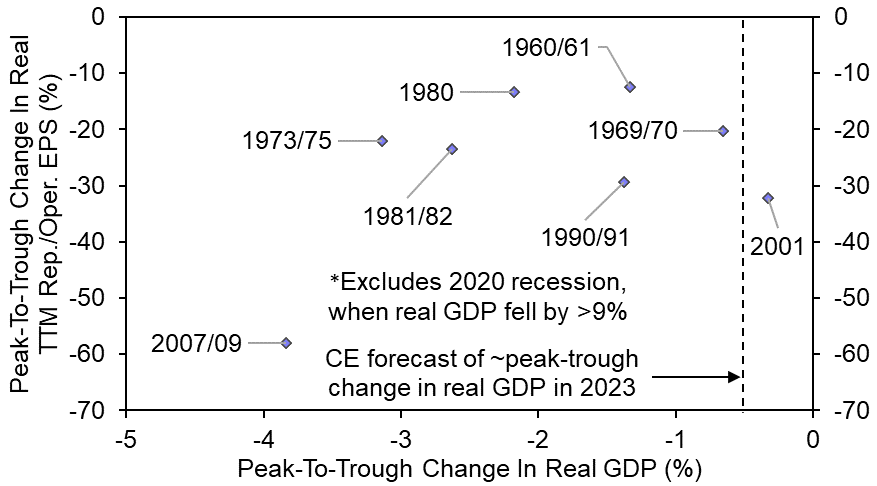
- The recession we forecast this year would be mild by past standards – a cumulative drop in US real GDP of ~0.5% spread across Q1, Q2 and Q3. However, there has not been a good correlation since 1960 between peak-to-trough changes in US real GDP and S&P 500 real TTM EPS. Indeed, there were two recessions (1969/70 and 2001) when the peak-to-trough change in real GDP was similar to the fall we forecast in 2023, but when the peak-to-trough change in real TTM EPS exceeded 20%. (See Chart 7.) A more rapid economic recovery in China than we had previously envisaged (following the recent change to COVID policy there) and a potentially less severe downturn than we have been anticipating in Europe (thanks partly to lower natural gas prices) would be good news for the US multinationals that dominate the S&P 500. Even so, we don’t see why the drop in real TTM EPS this time around should be especially small.
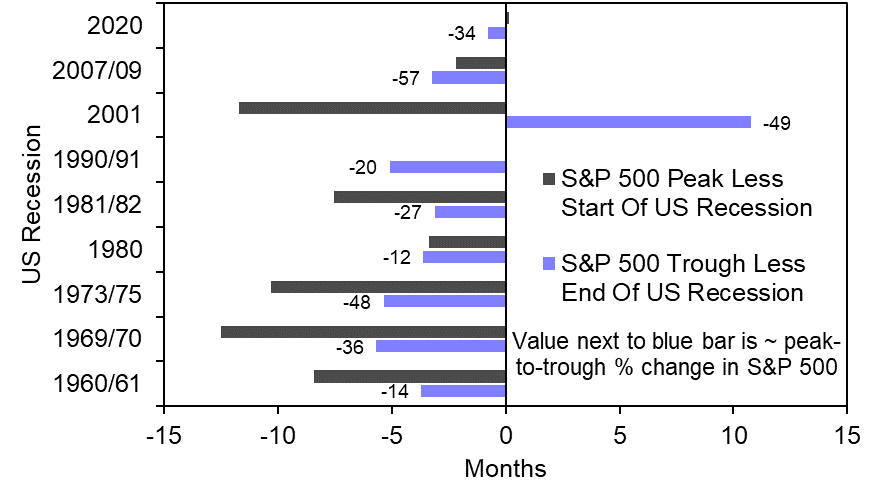
- Point 3: When earnings have faltered, the S&P 500 hasn’t typically bottomed out until 3-6 months before the end of the accompanying US recession. (See Chart 8.) If the index bottomed out last October, this would have been about eleven months before we expect this year’s recession to end – an unprecedented gap since 1960. Our best guess is that it will revisit a similar low of ~3,500 this spring. The implied peak-to-trough change would be slightly less than the median drop of just over 30% in bear markets around recessions since 1960 (if the “outlier” drawdown in equities that outlasted the 2001 recession is excluded).
- Point 4: The index has tended to do very well after its cyclical low point around a recession has been reached. In every case since 1960, the turnaround was significant, with a median gain in the nine episodes of ~38% in the next twelve months. Our end-2023 forecast for the S&P 500 is 4,200, which would be a conservative 20% jump from 3,500. 4,200 would be consistent, for example, with a multiple of 16.8 (the ~average for the second half of the 2010s) applied to FTM EPS of ~$250 (nearly 5% above the 2022 high). Our end-2024 forecast is 4,500, which would still leave the index below its end-2021 peak of ~4,800. It is not unusual, however, for the S&P 500 to still be below its previous peak two years after it bottomed out.
|
Chart 1: S&P 500 Price, FTM EPS (I/B/E/S), |
Chart 2: S&P 500 Selected FTM EPS |
|
|
|
|
Chart 3: S&P 500 Selected FTM SPS (I/B/E/S) |
Chart 4: S&P 500 Selected Margins (FTM EPS / FTM SPS) |
|
|
|
|
|
|
|
|
|
|
|
|
|
|
|
|
Sources: Refinitiv, Shiller, NBER, Capital Economics. |
John Higgins, Chief Markets Economist, john.higgins@capitaleconomics.com