Last week we published revised economic and market forecasts based on different scenarios for how the Iran war develops. In this week’s note, I answer the key questions we have been asked in subsequent client briefings.
1. What is the likely impact on economic growth? How great is the risk of recession?
The economic consequences of the war will depend on five factors. The first is the duration of the conflict, particularly the length of time that disruption to shipping through the Strait of Hormuz persists and the extent to which global energy supplies are reduced and their prices rise. Second is countries’ net energy trade positions – that is, whether they are net importers or exporters of energy and therefore exposed to a negative or favourable terms-of-trade shock. The third factor is the energy intensity of GDP (i.e. the quantity of oil and gas required to produce a unit of output). The fourth is the extent to which governments shield households and firms from higher energy costs. And fifth is the response of central banks.
There is considerable uncertainty around all these factors, especially the duration of the conflict and the scale of any sustained disruption to energy supplies. Accordingly, it makes sense to think about the economic consequences of the war in terms of different scenarios.
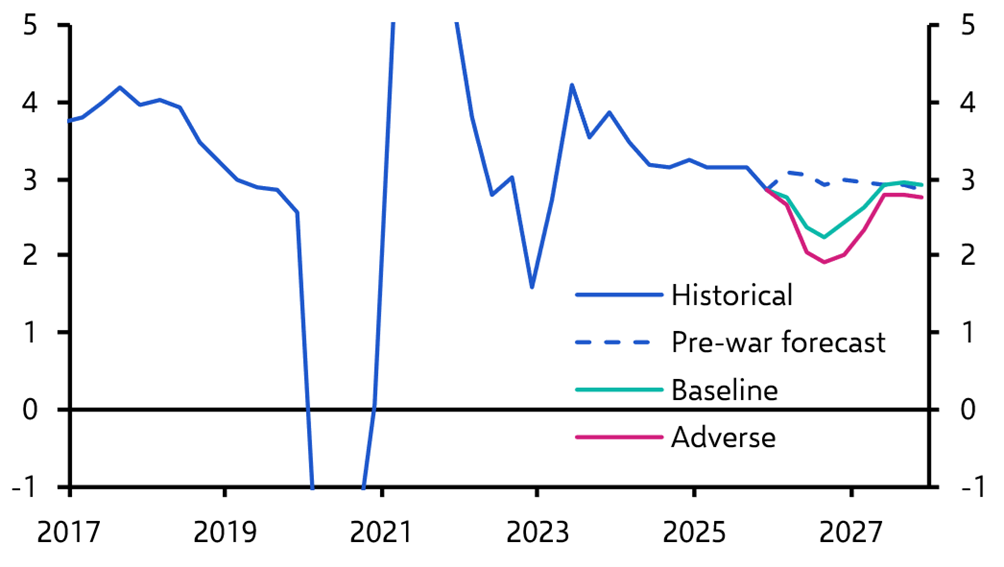
In our baseline scenario, which assumes a severe but short-lived conflict, global growth slows in Q2 as higher energy prices squeeze real incomes and raise business costs. But assuming energy shipments through the Strait begin to normalise by the end of April, the damage remains limited and a global recession is avoided.
In an adverse scenario, where the conflict persists through the first half of this year and disruptions to energy supplies are more extensive, the economic hit would be more significant. Europe would probably fall into recession and growth would slow markedly across Asia. The US would probably avoid an outright recession in both scenarios, but consumer spending would weaken noticeably in the adverse case around the middle of the year. In this scenario, the slowdown in world GDP growth would be sufficient to meet most definitions of a global recession. (See Chart 1.) (For more, see our latest Global Economic Outlook.)
|
Chart 1: Real World GDP (% y/y) |
|
|
|
Sources: LSEG Data & Analytics, Capital Economics |
2. How will the war affect inflation?
The inflationary consequences of the conflict depend primarily on the scale and persistence of disruption to energy flows through the Strait of Hormuz and the associated increase in commodity prices.
Oil and gas are the most important channels, but they are not the only ones. Several industrial inputs also move through the Strait, including helium (used in semiconductor manufacturing), sulphur (used in plastics) and fertiliser. The inflationary impact of price increases in these goods will vary across countries depending on import dependence and the weight of these items in CPI baskets.
In some emerging markets, fuel subsidies may cushion the impact on consumer prices, though this would come at the cost of weaker fiscal positions.
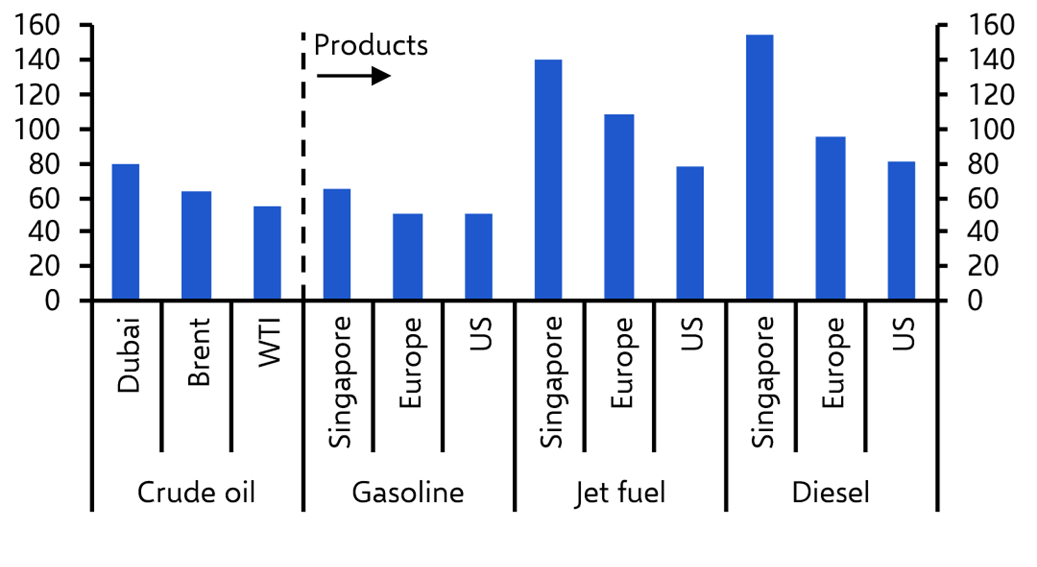
The first inflationary effects are likely to appear in refined fuel products, particularly petrol. These increases are already being seen most clearly in parts of Asia that import large volumes of crude and refined products from the Gulf. Diesel and gasoline prices have also risen in Europe and, to a lesser extent, in the United States. (See Chart 2.)
|
Chart 2: % Change in Fuel Prices Since War Began (Latest = 27th Mar.)* |
|
|
|
Sources: LSEG Data & Analytics, Capital Economics *US = Gulf Coast. Europe = Amsterdam, Rotterdam, Antwerp region. |
Higher energy costs will eventually feed through to household electricity and utility bills. This tends to occur with a lag and depends heavily on how electricity markets are structured. In general, the pass-through will be larger in Europe and parts of Asia than in the US.
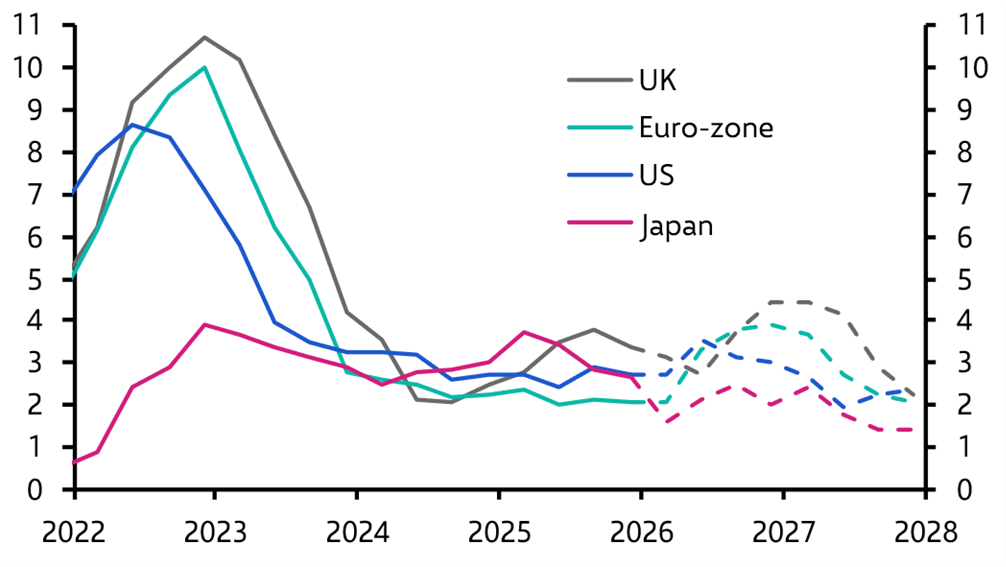
As a result, inflation is likely to peak earlier in the US but rise higher and remain elevated for longer in Europe and parts of Asia. In our projections, inflation in the euro-zone and the UK peaks at around 4% in the baseline scenario and above 6% in the adverse scenario, both in the second half of the year. In the US, inflation peaks earlier in the year. (See Chart 3.)
|
Chart 3: Baseline Scenario Headline Inflation (%) |
|
|
|
Sources: LSEG Data & Analytics, Capital Economics |
Disruptions to supplies of inputs such as helium and sulphur will depend heavily on the duration of the conflict. In the baseline scenario we do not expect major shortages or long-lasting price spikes. In the adverse scenario, however, supply constraints could add to inflationary pressures.
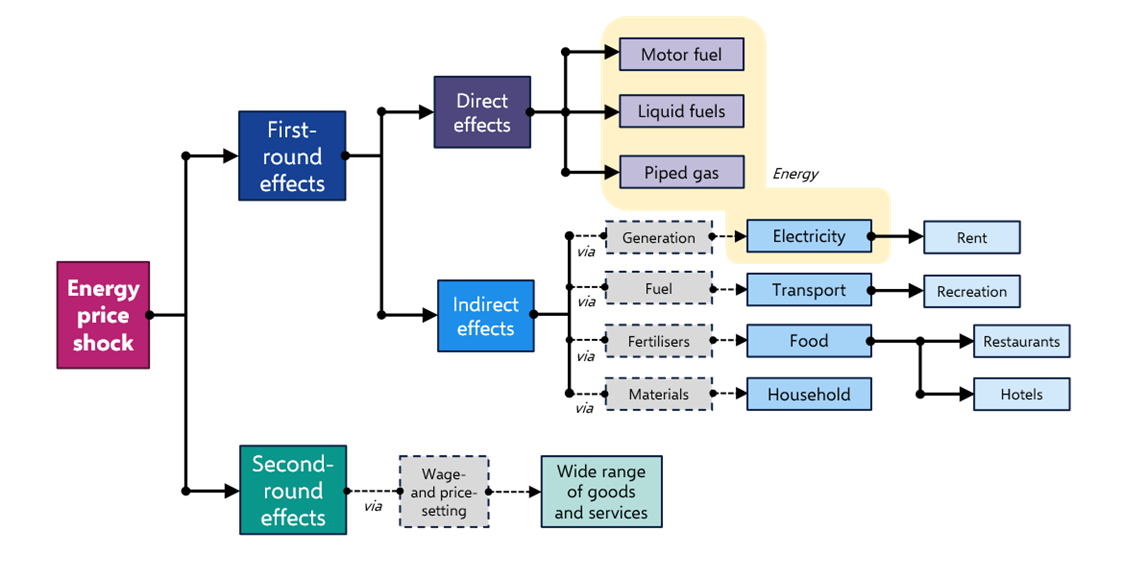
Second-round effects through wages and pricing behaviour are possible but likely to be limited. Even in the adverse scenario they would probably be smaller than in 2022, when labour markets were considerably tighter. Chart 4 provides a framework for thinking through the channels through which inflation will be affected as the war evolves.
|
Chart 4: Where will higher energy prices show up in the CPI? |
|
|
|
Sources: Capital Economics |
3. How will the conflict affect global trade?
The conflict affects world trade mainly through disruption to energy shipments rather than through broader supply chains.
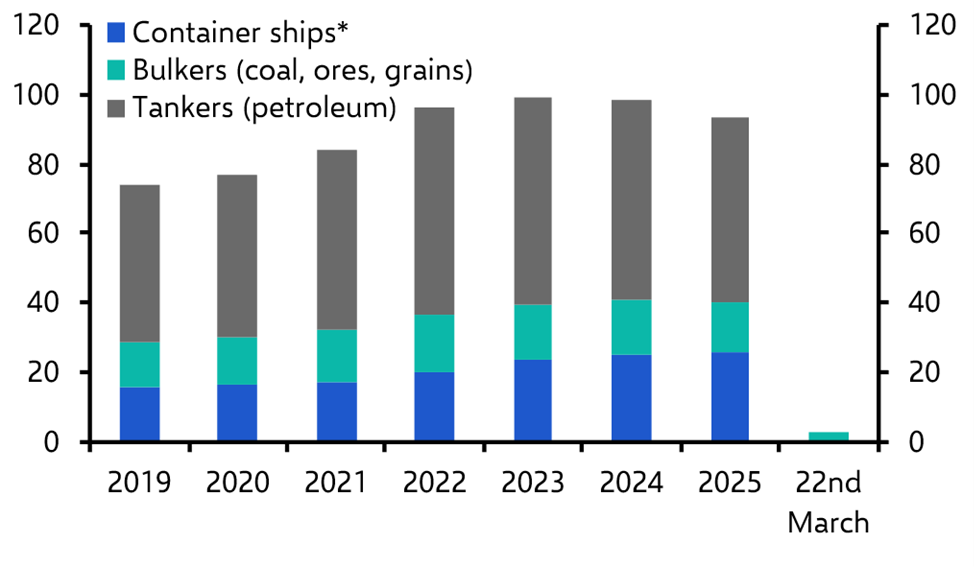
The effective closure of the Strait of Hormuz has brought roughly a quarter of global seaborne oil trade and around one-fifth of LNG shipments almost to a halt. (See Chart 5.) In value terms, this represents around 2% of world trade. The trade impact is concentrated in Asia, which imports about two thirds of the energy exports that normally pass through the Strait.
|
Chart 5: Average Daily Vessel Arrivals Into the Strait of Hormuz |
|
|
|
Sources: IMF Portwatch, Capital Economics. *Includes general cargo vessels and Ro-Ros. Given the conflict, reports of vessel GDP jamming and AIS spoofing suggest latest figures should all be considered low estimates. |
By contrast, the risks to container shipping appear limited. Trade through the Suez Canal had already been heavily disrupted by Houthi attacks in 2023-24, prompting shipping companies to reroute vessels around the Cape of Good Hope. As a result, container traffic in the region was already depressed and freight rates have moved little since the conflict began.
Air freight disruptions are somewhat more significant because the Middle East acts as a major aviation hub linking Europe, Asia and Africa. Around 3% of world trade by value normally passes through these hubs. But cargo airlines have spare capacity and have already begun diverting flights to alternative hubs and routes. While this will increase journey times and costs, the overall impact on global trade should remain limited.
Over the medium term, the bigger risk to trade may come from weaker demand. If higher energy prices persist, the squeeze on real incomes would reduce demand for traded goods and could also delay the interest-rate cuts that might otherwise have supported global trade growth.
4. What is the outlook for oil, gas and other commodity prices?
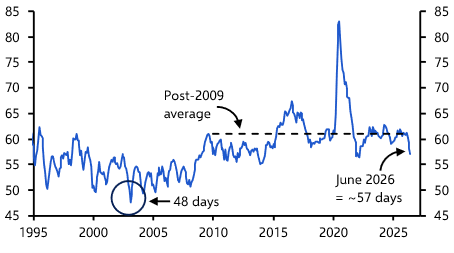
In our baseline scenario, energy prices begin to ease in the second half of 2026 as shipments through the Strait of Hormuz gradually resume. Oil markets recover more quickly than gas markets, however, because damage to Qatari LNG infrastructure leaves global gas supplies more constrained.
Overall, we assume that the disruption results in a loss of around 4% of global petroleum exports in 2026. Provided damage to oil infrastructure is limited and repairable, exports recover fully in 2027. Under this scenario, the price of Brent crude begins to fall in the second half of 2026 and declines to around $60 per barrel by the end of 2027. Refining margins and refined product prices also normalise over that period.
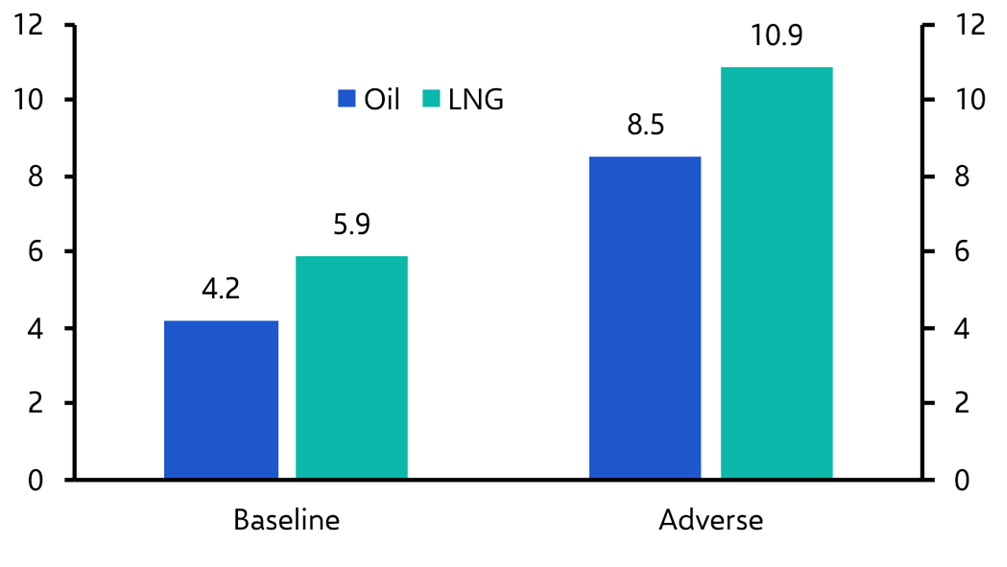
Gas markets are likely to remain tighter for longer. Damage to LNG facilities in Qatar is assumed to remove around 6% of global LNG exports in 2026, with some disruption persisting into 2027. (See Chart 6.) With limited spare export capacity elsewhere, this will push European and Asian benchmark gas prices significantly higher relative to US prices.
|
Chart 6: Estimated Loss of Energy Exports in 2026 (% of Global Pre-War Baseline) |
|
|
|
Sources: LSEG Data & Analytics, Capital Economics |
In our baseline scenario, the ratio between European and Asian gas benchmarks and US prices widens from roughly two to three times in 2025 to around four to six times by the end of 2026.
Higher energy prices also tend to feed through to agricultural markets. That relationship may be stronger than usual this time given the disruption to fertiliser supplies. Meanwhile, gold prices have fallen since the conflict began and are likely to fall further this year, while industrial metals will remain under pressure from weak demand in China. Aluminium prices may fare somewhat better than copper, however, as aluminium supply is directly affected by the conflict.
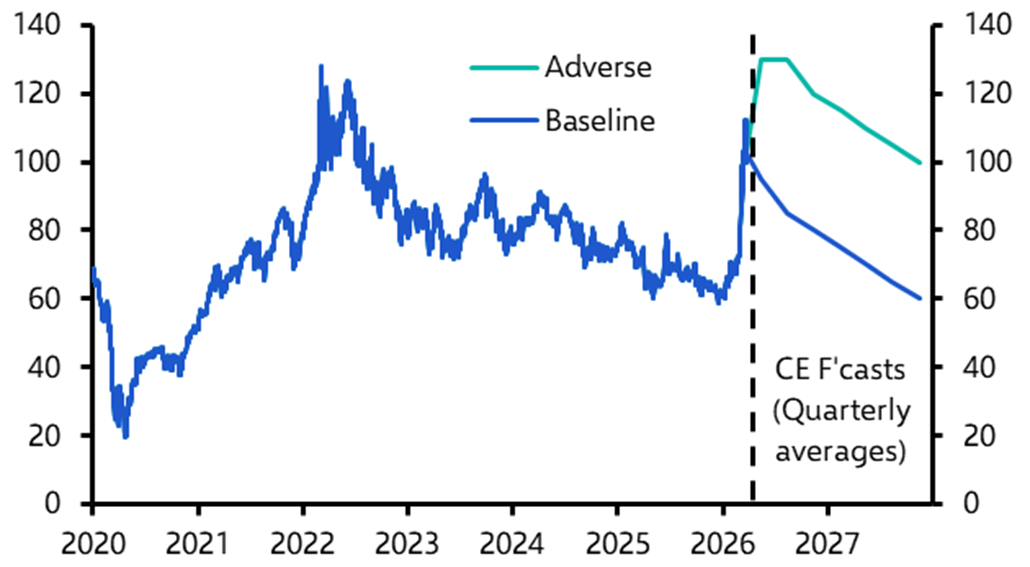
In a more adverse scenario, where disruption lasts longer or energy infrastructure suffers greater damage, the outlook would be more inflationary. Brent crude could remain in triple-digit territory through 2026 and 2027, while European and Asian gas prices could end 2027 at roughly three times their pre-war levels. (See Chart 7.)
|
Chart 7: Brent Crude Price ($pb) |
|
|
|
Sources: LSEG Data & Analytics, Capital Economics |
5. How are central banks likely to respond?
Central banks face a dilemma when responding to supply-driven price shocks.
On the one hand, higher energy prices raise headline inflation and risk feeding into inflation expectations and wage-setting behaviour. On the other, they squeeze real incomes and weaken demand, which should ultimately act to dampen inflation.
The key difference compared with the energy shock that followed Russia’s invasion of Ukraine in 2022 is that policymakers are not starting from a position of ultra-loose monetary policy or exceptionally tight labour markets. Interest rates are already close to neutral in most advanced economies and labour markets have loosened somewhat. As a result, it would take a much larger and more persistent shock – and clear signs that inflation expectations are drifting higher – to justify aggressive tightening.
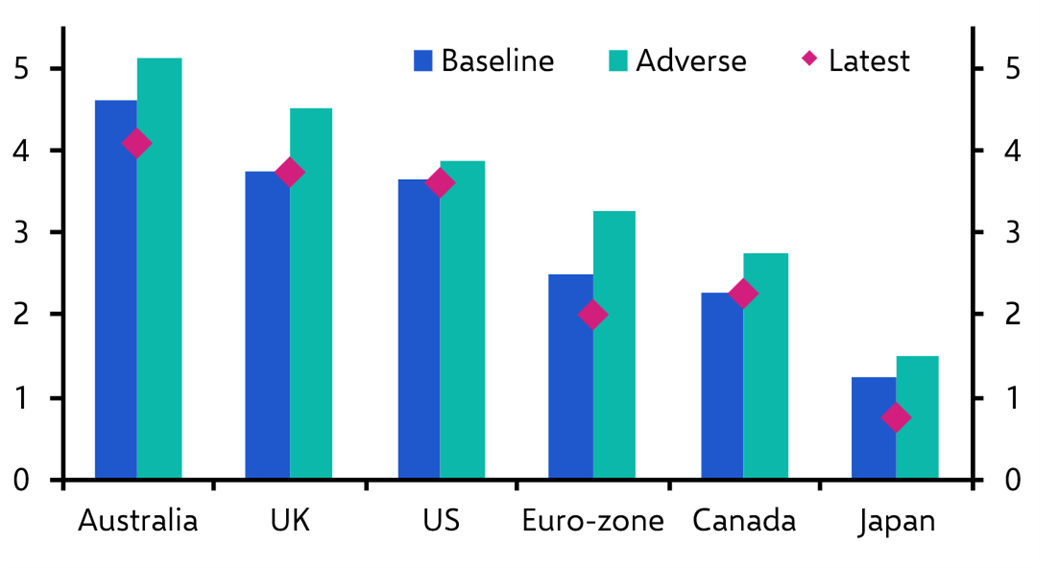
In the baseline scenario, central banks that had already begun tightening – such as the Bank of Japan and the Reserve Bank of Australia – would likely raise rates further. The ECB may also tighten modestly due to concerns about inflation expectations. By contrast, the Federal Reserve, and potentially the Bank of England, would probably be able to look through the shock and leave policy rates unchanged. (See Chart 8.) The profile for interest rates in our baseline scenario is below that which is currently priced into markets across all major economies.
|
Chart 8: Latest & End-2026 Policy Interest Rates (%) |
|
|
|
Sources: LSEG Data & Analytics, Capital Economics |
In the adverse scenario, the balance of risks shifts. With inflation expectations likely to rise significantly, most central banks would tighten policy during 2026 despite weaker activity. As the squeeze on real incomes intensifies and inflation eventually retreats, that tightening cycle would likely give way to rate cuts in 2027.
6. Will governments respond with fiscal support?
In some cases, fiscal support will occur automatically through existing policies. Many emerging markets operate fuel subsidies, which will absorb part of the price shock. Japan also maintains price controls on petroleum products and subsidies for electricity and gas that will limit the pass-through to households. (See here and here.)
Elsewhere, however, large discretionary fiscal packages are unlikely. In Europe, household energy bills are closely tied to natural gas prices and, in both our baseline and adverse scenarios, the increase in gas prices is smaller than the surge seen in 2022. At the same time, fiscal positions are generally weaker and bond yields higher than they were during the pandemic and the energy crisis, limiting governments’ scope to provide large-scale support. Accordingly, fiscal support is likely to be smaller this time around. The three-month cut in fuel duty that has just been announced by Australia’s government is a case in point – we estimate it will cost less than 0.1% of GDP, whereas the cost of fiscal support in the euro-zone during the 2022 energy crisis cost more than 3% of GDP.
7. How quickly could conditions return to normal?
Even if the conflict were resolved relatively quickly, the restoration of normal energy flows would probably be gradual rather than immediate.
Oil producers in the Middle East have already shut in significant volumes of production. Estimates suggest that between 7 and 10 million barrels per day of output may currently be offline. Restarting these wells and bringing production back to normal levels will take time.
Producers could temporarily draw on stored inventories to maintain exports, but this would only partly offset the loss of production. Even once supply resumes, it takes weeks for tankers to reach refineries and additional time for refined products to move through supply chains to end consumers. Accordingly, even after a ceasefire or peace agreement, it could take several weeks – and potentially longer – before shortages are fully resolved and oil markets stabilise.
The disruption to natural gas markets will persist for longer. Qatar Gas has said it will take 3-5 years to fully restore production capacity following strikes to facilities earlier this month. And even if this proves a conservative estimate, the duration of the damage to supply will be measured in years rather than months. For this reason, we expect natural gas prices to rise over the course of this year as storage facilities are refilled, even in the baseline scenario in which the conflict is short-lived.