
The global economy will remain relatively resilient in the face of mounting headwinds. However, growth will become increasingly unbalanced, with the US leading the way while Europe and China struggle.
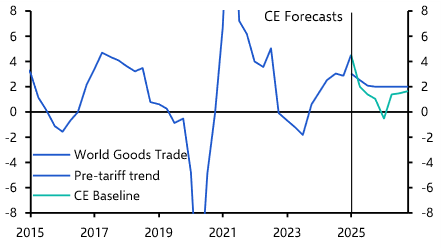
As we anticipated in our Q2 Global Economic Outlook, tariffs are having a limited adverse impact on global activity so far. Export orders are soft but not collapsing. And we expect a continued lack of retaliation and some rerouting of US-China trade to mean that world trade slows but doesn’t slump. (See Chart 1.)
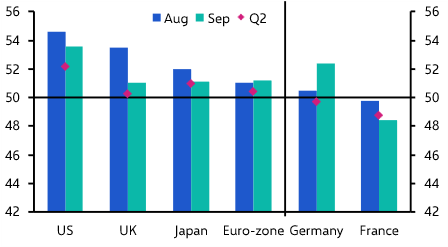
Otherwise, the global economy seems to be holding up fairly well. There have been some signs of improvement in advanced economies recently, with the composite PMIs rising in Q3 compared to Q2. (See Chart 2.)
|
Chart 1: Real World Goods Trade (% y/y) |
Chart 2: Composite PMIs (September = Flash) |
|
|
|
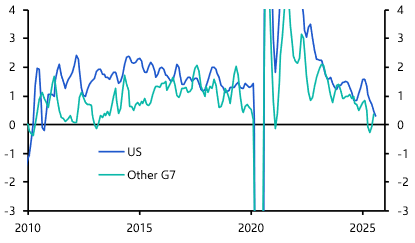
Admittedly, the weakness of labour markets is a concern. It’s worth noting that this trend is common to most advanced economies, not just the US. (See Chart 3.) But it is rare for labour market downturns alone to presage recessions. Other types of economic activity are holding up better, supported by recent falls in policy rates and rising credit growth despite the widespread increase in long-term government bond yields.
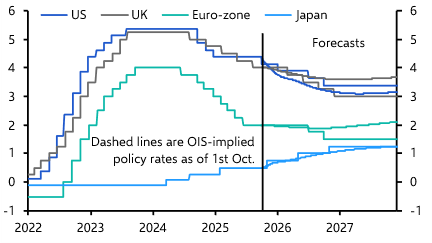
In the US, immigration curbs are set to continue limiting labour supply. But the strength of AI investment is likely to more than offset this drag. We expect GDP growth there to accelerate, and inflation to remain elevated at around 3% due to a combination of sticky services inflation and some tariff effects feeding through. Accordingly, we think that the Fed will reduce interest rates by less than markets are pricing in. (See Chart 4.)
|
Chart 3: Employment (%, 3m/3m annualised) |
Chart 4: DM Policy Interest Rates (%) |
|
|
|
Across the euro-zone, growth will remain weaker than the consensus expects as productivity growth remains weak and the demographic drag intensifies. Fiscal expansion will boost growth in Germany, but not by much. In contrast to the US, price pressures in the euro-zone are weakening with wage growth easing and natural gas prices falling. With inflation likely to fall below target, the ECB has scope to cut interest rates further next year.
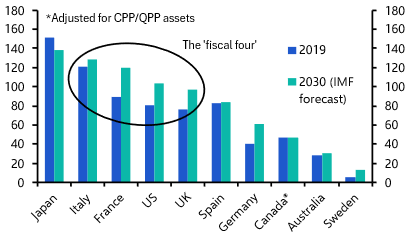
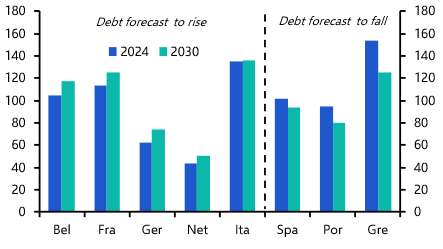
Fiscal strains will remain a source of concern, most notably in the US, UK and France given their poor debt dynamics. (See Chart 5.) The UK government will respond with tax hikes which are likely to keep growth subdued in the months ahead. Austerity in France will be a very slow process, given its difficult political situation. The spread of OATs over Bunds will rise further, but we don’t expect this to spiral into a fiscal crisis. Meanwhile, in the US, we expect tariff revenues to prevent the deficit from widening much further. And while Italy’s public finances remain fragile, we think its government will make further progress in cutting the deficit without doing too much harm to the economy.
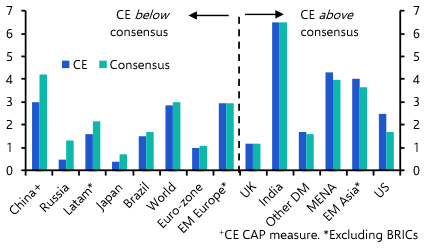
Finally, growth in most emerging economies will remain soft. With both fiscal easing and exports set to provide less of a prop, we expect GDP growth of just 3% over the rest of this year and next in China. Meanwhile, high interest rates will weigh on demand in Brazil. But there will be pockets of relative strength, including India and the Gulf economies. Our forecasts are stronger than the consensus view in the US, the Gulf and parts of Asia. Meanwhile, our projections for China, Russia and Latin America are comparatively downbeat. (See Chart 6.)
|
Chart 5: General Government Net Debt (% of GDP) |
Chart 6: Capital Economics Vs Consensus GDP Forecasts (% y/y 2026) |
|
|
|
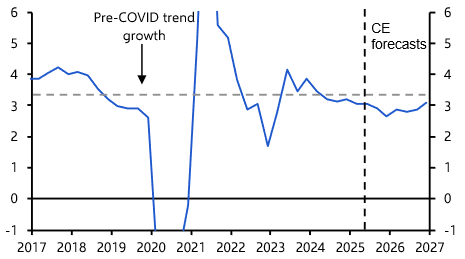
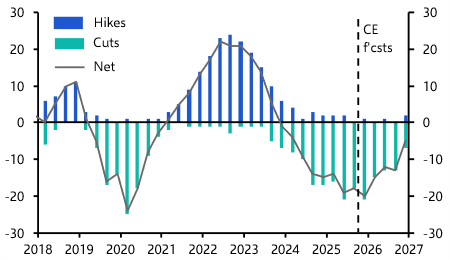
The net result is that global GDP growth will remain soft by past standards. (See Chart 7.) And while the global monetary policy loosening cycle will soon be past its peak pace, there are still a significant number of interest rate cuts to come in 2026. (See Chart 8.)
|
Chart 7: Real World GDP (% y/y) |
Chart 8: Number of Rate Cuts/Hikes by Major Central Banks |
|
|
|
|
Sources: USITC, LSEG, CEIC, Capital Economics. |
United States
AI boom to offset drag from immigration curb
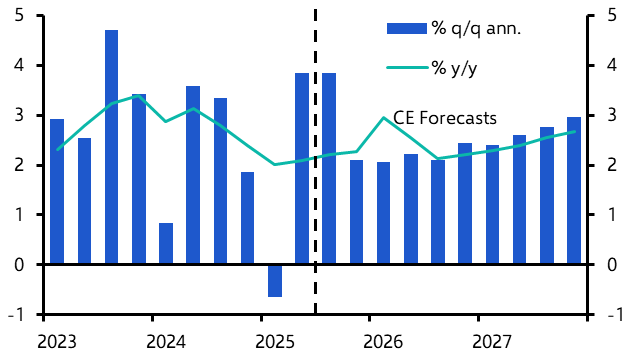
We now expect tariffs to have only a very limited impact, with the AI investment boom and the immigration crackdown proving to be the bigger economic drivers. With the AI boom set to drive a resurgence in productivity, we think that, even as the curbs on immigration weigh on the labour force, GDP growth will accelerate from 2.1% this year to 2.5% in both 2026 and 2027. (See Chart 9.)
The slowdown in employment growth is due to some combination of all those three factors. (See Chart 10.)
|
|
|
|
|
|
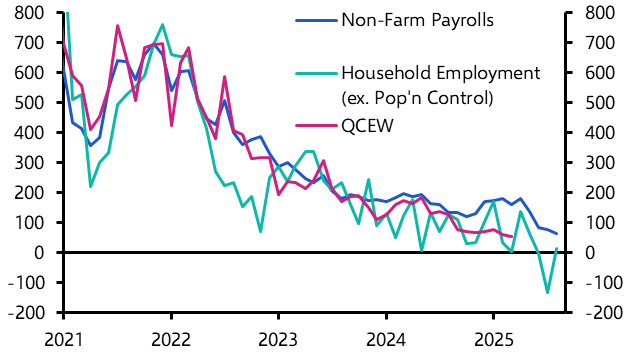
To the extent that it reflects uncertainty over tariffs, we should expect some improvement now that the Trump administration is closing deals with major trading partners. At this stage, however, we suspect the immigration crackdown is playing a bigger role. The AI investment boom also appears to be weighing on employment of younger workers. The impact of those latter two factors could continue to weigh on employment growth for some time.
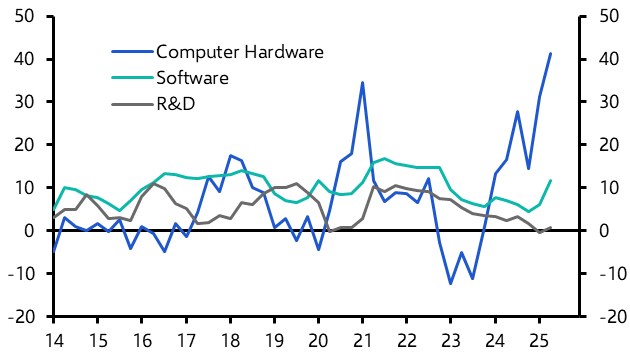
In the first half of this year, investment in computer hardware and software soared and we expect those faster growth rates to be sustained. (See Chart 11.) Spending on data centres should also cushion any drop back in investment in hi-tech manufacturing plants.
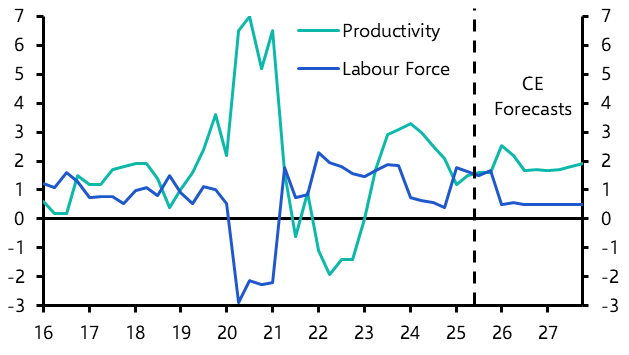
One of the key questions for next year is whether that boost to productivity growth helps to offset the weakness in labour force growth stemming from the crackdown on not just unauthorised immigration, but also now legal migration too? We are increasingly confident it will. (See Chart 12.)
|
|
|
|
|
|
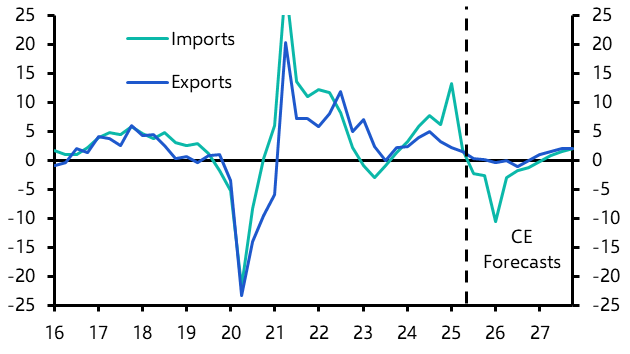
We originally expected Trump’s tariffs to subtract from US GDP, as the dollar strengthened and other countries retaliated. But the trade-weighted dollar has fallen and, as part of the panic to retain favourable access to US markets, other countries appear willing to lower tariffs on exported US goods. As a result, we have pared back how far we think exports and imports will fall. (See Chart 13.)
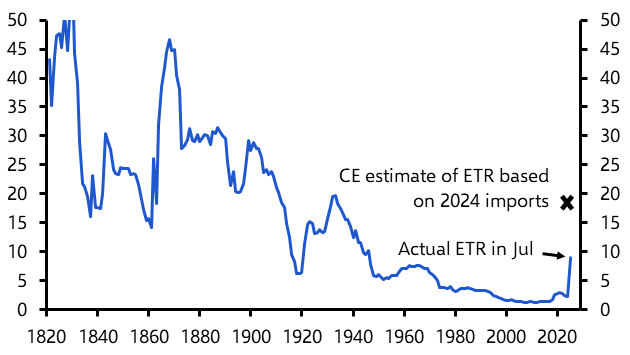
Tariffs have also had little effect on final consumer prices, in part because the effective tariff rate was still only 9.5% in July, well below the near-20% rate we would have expected based on pre-tariff import shares. (See Chart 14.)
|
|
|
|
|
|
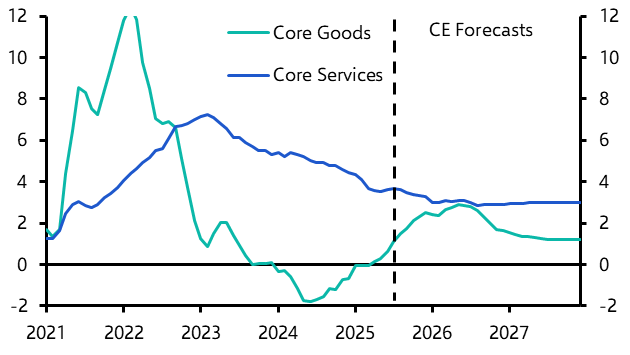
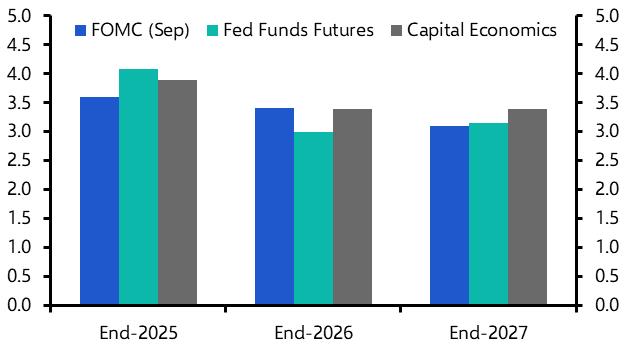
In addition, importing firms are absorbing the tariffs by reducing margins rather than passing on those higher costs to consumers. Nevertheless, we expect core services inflation to remain elevated, even as housing inflation drops back further. (See Chart 15.) With the latter keeping core PCE inflation well above the 2% target next year, we expect the Fed to cut its policy rate by only 75bp over the next 12 months. (See Chart 16.)
|
|
|
|
|
|
|
Sources: LSEG, USITC, Federal Reserve, Capital Economics. |
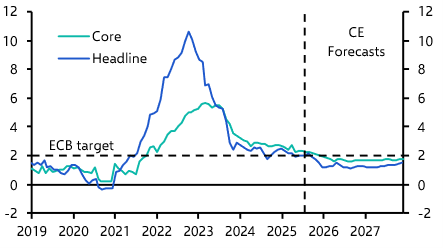
We expect GDP growth to remain subdued. Headline and core inflation are likely to fall below 2% next year, prompting the ECB to cut interest rates.
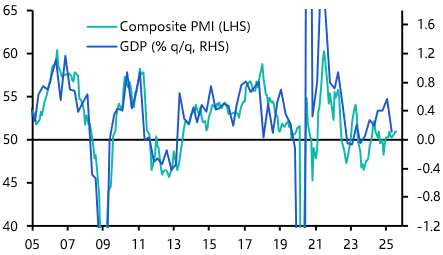
The front-running of US tariffs gave the economy a boost in Q1 but growth slowed sharply in Q2 and surveys (though quite unreliable recently) point to a similar performance in Q3. (See Chart 17.)
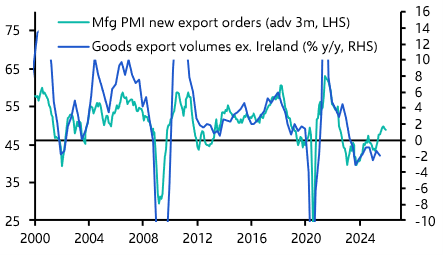
That said, growth should pick up a bit heading into next year. Consistent with our long-held view that US tariffs would have only a very small negative impact on the economy, export orders have actually risen this year. (See Chart 18.)
|
|
|
|
|
|
And looser fiscal policy in Germany should boost aggregate demand. There is also scope for consumption to accelerate if households become less cautious and the saving rate falls from its very high level.
But the big picture is that that economic growth will remain subdued by international standards. And we think that growth in 2027 will be much weaker than the ECB and consensus expect because underlying productivity growth remains weak and the demographic drag will intensify. (See Chart 19.)
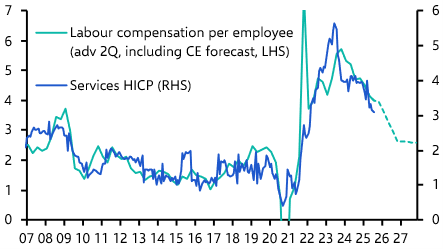
Meanwhile, surveys suggest that the labour market is continuing to loosen. Together with past declines in headline inflation, this is feeding through to slower wage growth and we expect it to keep falling. This is the key reason why we expect services inflation to decline further next year, pulling the core rate down below 2%. (See here and Chart 20.)
|
|
|
|
|
|
We also forecast oil and natural gas prices to decline, causing headline inflation to fall closer to 1%. (See Chart 21.)
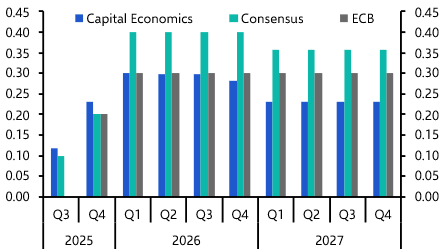
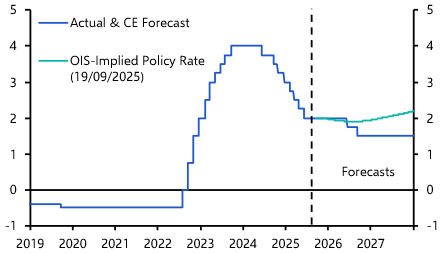
The ECB could “look through” a period of below-target inflation, particularly if the core rate were not far from 2%. But the risks are skewed towards rate cuts, particularly if policymakers were worried that inflation expectations could once again become stuck at a low level. We’ve pencilled in two rate cuts for next year, which would take the deposit rate to 1.5%. (See Chart 22.)
|
|
|
|
|
|
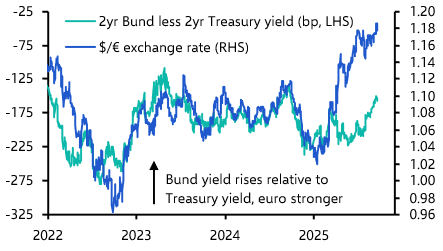
The shift in the association between bond yields and the exchange rate earlier this year has been sustained. (See Chart 23.) But we don’t think this means that interest rates no longer matter for the euro. Our view that the ECB will cut by more than expected and the Fed by less than expected suggests that the euro won’t rise further against the greenback.
Arguably the biggest risk to the outlook is the high and rising level of public debt in France. By contrast, debt ratios should continue to fall in Spain, Portugal and Greece. (See Chart 24.)
|
|
|
|
|
|
Japan
Japan will continue to shrug off global trade tensions
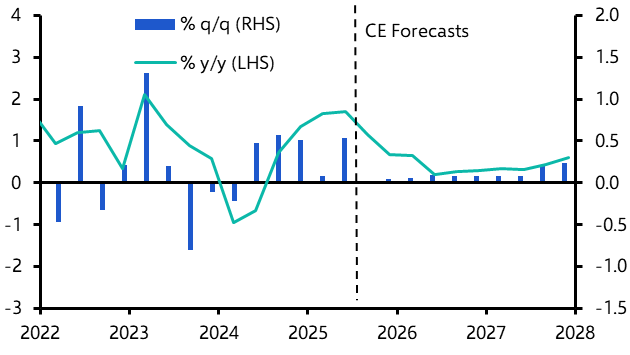
GDP growth will slow from its current above-trend rate to a more sustainable pace as external demand softens. However, with consumption growth still healthy and underlying inflation set to remain above the Bank of Japan’s 2% target, we expect the Bank to resume its tightening cycle in October.
The 0.3% q/q rise in Q2 GDP was for all the right reasons, with business investment, consumption and exports all rising. However, exports to the US in July were the lowest they’ve been since January and motor vehicle output slumped, too. We expect GDP growth to slow from its current above-trend rate towards a more sustainable pace. (See Chart 25.)
The BoJ is worried that a hit to corporate profits from higher US tariffs will weigh on business investment and wage growth. But while profit margins in manufacturing have weakened, they were around record highs across all industries in Q2. (See Chart 26.)
|
|
|
|
|
|
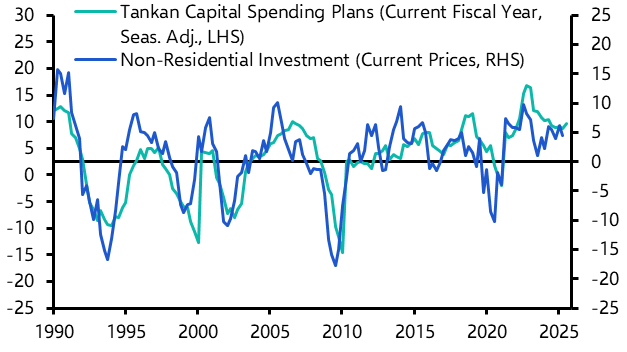
Encouragingly, firms’ capital spending plans also remained robust in the latest Tankan survey. (See Chart 27.)
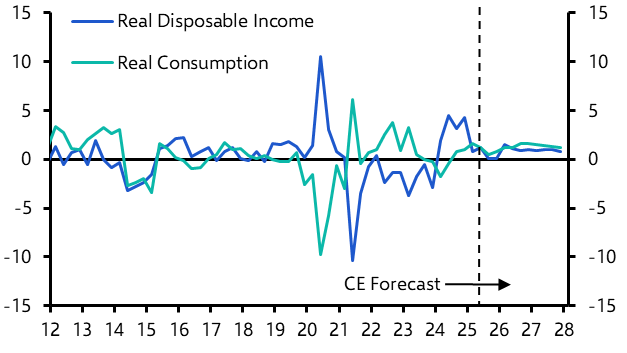
The Bank has been arguing that rapid price rises will keep consumer spending “more or less” flat for now. By contrast, we’ve correctly predicted that consumer spending will remain a bright spot this year. After all, real disposable income growth remains healthy. (See Chart 28.) What’s more, the elevated savings rate leaves plenty of scope for consumption to keep rising.
|
|
Chart 28: Real Disposable Income & Consumption (% y/y) |
|
|
|
The BoJ has downplayed the slowdown in regular earnings growth in the first half of the year. (See Chart 29.) Policymakers have instead put more emphasis on the continued strength in pay hikes in this year’s spring wage negotiations (Shunto). With consumer price inflation set to average nearly 3% this year, another robust pay hike in the upcoming Shunto appears likely.
Headline inflation has come off the boil, but inflation excluding fresh food and energy has reached fresh highs in recent months. Amidst concerns that household inflation expectations are on the rise, we expect the BoJ to resume its tightening cycle in October.
If we’re right and energy prices will drop sharply next year, headline inflation will fall below the Bank’s 2% target. (See Chart 30.) But with underlying inflation set to remain above that target, we expect the Bank to lift its policy rate to 1.5% by 2027.
|
|
Chart 30: Consumer Prices (Excl. tax, % y/y) |
|
|
|
The media narrative is that the recent surge in long-term government bond yields reflects concerns about the sustainability of Japan’s public finances. (See Chart 31.) With the budget deficit shrinking to a 30-year low in 2023 and probably having declined even further since then, that argument seems bizarre. (See Chart 32.) Granted, we do expect the 10-year JGB yield to rise further from 1.63% now to 2.0% by 2030. However, that’s mostly a reflection of our hawkish views on monetary policy.
|
|
|
|
|
|
United Kingdom
- More tax hikes in the Budget in November adds to our view that inflation in the UK won’t remain higher than in the euro-zone and that the Bank of England will cut interest rates from 4.00% now to 3.00% next year rather than to 3.50% as investors expect. (See Chart 33.)
- The lingering drags from the previous rises in interest rates, the hikes in business taxes in April and soft overseas activity explain why we think GDP growth will slow from 1.5% this year to 1.2% next year. (See Chart 34.)
- That said, the Budget on 26th November may dampen growth. To prevent her from breaking the rules and to restore her fiscal headroom of £9.9bn, we estimate the Chancellor will need new policies that raise £28bn in 2029/30. (See Chart 35.) With Labour MPs unwilling to stomach spending cuts and the markets unlikely to tolerate more borrowing, higher taxes, this time for households, may do the heavy lifting. A fiscal tightening of £28bn (0.8% of GDP) would trim GDP growth by 0.2%.
- This would leave the budget deficit on track to fall from 5.1% of GDP in 2024/25 to 2.0% in 2028/29. That’s a much bigger fall than is likely in France (see Chart 36), meaning the chances of a fiscal crisis involving a leap in yields is higher in France. Even so, all the ingredients for a fiscal crisis, bar a trigger, are in place. We are not forecasting a UK crisis, but it’s a risk.
- Some of the possible tax hikes that have been mooted over the past month would boost CPI inflation for a year. But by hitting households’ real incomes, higher taxes would also weigh on inflation further ahead.
- Indeed, they would add to the weakness in employment that was triggered by the rises in National Insurance Contributions for employers in last year’s Budget. Since then, payroll employment has fallen by 0.5% and the somewhat unreliable LFS unemployment rate has risen from 4.3% to 4.7% in July. We expect the unemployment rate will peak at 5.0% in the first half of next year. (See Chart 37.)
- What’s more, our CE Unemployment Proxy suggests the labour market is weaker than the unemployment rate suggests. (See Chart 38.) And the job vacancy rate implies the labour market is looser in the UK than in the euro-zone and the US. (See Chart 39.)
- That loosening should feed through into a more marked easing in wage growth in the UK and a fall in CPI inflation to the 2.0% target by 2027. That would leave it no higher than in the euro-zone. In fact, we are forecasting UK inflation to be below 2.0% in 2027. (See Chart 40.)
|
Table 6: UK Key Forecasts (% y/y, unless stated) |
|||||
|
Ave. |
Forecasts |
||||
|
14-23 |
2024 |
2025 |
2026 |
2027 |
|
|
Private cons’ptn |
1.6 |
-0.2 |
0.9 |
1.5 |
1.8 |
|
Total fixed invest. |
3.2 |
1.8 |
2.6 |
2.4 |
2.9 |
|
Gov’t cons’ptn |
1.8 |
3.4 |
2.5 |
1.9 |
1.5 |
|
Stockbuilding1 |
0.0 |
0.2 |
0.1 |
0.0 |
0.0 |
|
Domestic demand |
1.8 |
1.7 |
1.7 |
1.4 |
1.9 |
|
Exports2 |
2.5 |
0.7 |
3.9 |
2.4 |
2.7 |
|
Imports2 |
2.6 |
2.6 |
4.4 |
2.7 |
3.9 |
|
GDP |
1.7 |
1.1 |
1.5 |
1.2 |
1.5 |
|
Consumer Prices3 |
2.9 |
2.5 |
3.5 |
2.9 |
1.9 |
|
RPIX3,4 |
4.1 |
2.8 |
4.2 |
3.8 |
2.9 |
|
Real disp income |
1.5 |
4.4 |
1.7 |
1.3 |
1.6 |
|
H’hold sav. Ratio5 |
8.1 |
10.1 |
10.6 |
10.4 |
10.0 |
|
LFS Employment |
1.0 |
0.8 |
1.7 |
0.9 |
1.3 |
|
Unemp. Rate3 |
4.6 |
4.3 |
4.7 |
4.9 |
4.7 |
|
Interest rate6 |
1.24 |
4.75 |
4.00 |
3.00 |
3.00 |
|
PSNB1 |
4.9 |
5.0 |
3.9 |
3.0 |
2.0 |
|
Current account1 |
-3.3 |
-2.2 |
-3.0 |
-2.4 |
-2.5 |
|
Sources: LSEG, Capital Economics. 1) % of GDP, 2) Including Valuables, 3) Annual average, 4) Retail Price Index excl. mortgage interest, 5) As a % of disposable income, 6) Bank Rate, end period. |
|||||
United Kingdom Charts
|
|
|
|
|
|


|
|
|
|
|
|


|
|
|
|
|
|


|
|
|
|
|
|
|
|
Sources: |


- We forecast average annual GDP growth of 1.0% next year, with a further rise in the unemployment rate – against a backdrop of near 2% inflation – prompting the Bank of Canada to cut its policy rate to 1.75%.
- With employment falling in the past two months, it is possible that a negative feedback loop will develop and the economy has already succumbed to recession. Our baseline view, however, is that the extent of the weakness in exports and investment in the second quarter (see Chart 41) leaves scope for both to partially rebound now that firms have some certainty about the tariff regime.
- As household income growth is slowing rapidly, we expect consumption growth to likewise slow sharply from recent strong rates, which means that overall GDP growth is set to remain close to 1% annualised for the next few quarters. (See Chart 42.) With the household saving rate still somewhat above its pre-pandemic norm, one upside risk to our forecast is that households will further reduce saving to support spending. (See Chart 43.)
- On the whole, however, the risks seem tilted toward more muted growth. Our forecasts assume that the US, Canada and Mexico reach a deal that keeps the USMCA alive. If the US instead pulls out, that would subject a far greater share of exports to tariffs.
- Fiscal policy may also become a drag on activity. Prime Minister Mark Carney has recently taken a firmer tone on the need for an “austerity budget” that reins in operational spending to support long-run investment, which could involve bringing public sector employment back down. (See Chart 44.)
- The recent strength of housing starts also looks inconsistent with plunging immigration and falling rents. Favourable public financing explains much of the strength but, if demand remains weak, the risk is that this type of construction will freeze up. (See Chart 45.)
- We expect population growth to settle near 0.3% y/y, rather than turn slightly negative as the government pledged. That should ensure that shelter price inflation continues to normalise, but we still see reason to expect rent inflation to remain slightly above pre-pandemic norms (See Chart 46), which will keep core inflation marginally above the Bank of Canada’s 2% inflation target. (See Chart 47.)
- That will somewhat limit the extent to which the Bank provides policy support, but we still expect the Bank to cut its policy rate three more times, to 1.75%. (See Chart 48.)
|
Table 7: Canada Key Forecasts (% y/y unless stated) |
|||||
|
Avg. |
Forecasts |
||||
|
14-23 |
2024 |
2025 |
2026 |
2027 |
|
|
Private cons’ptn |
2.2 |
1.6 |
2.8 |
1.5 |
1.4 |
|
Total fixed investm’t |
0.2 |
0.1 |
0.6 |
0.0 |
2.8 |
|
Gov’t cons’ptn |
2.2 |
3.7 |
2.7 |
1.5 |
0.9 |
|
Stockbuilding1 |
0.2 |
-1.1 |
0.2 |
0.3 |
0.0 |
|
Dom’stic demand |
0.1 |
2.1 |
2.3 |
1.2 |
1.6 |
|
Exports |
2.3 |
0.6 |
-2.5 |
0.3 |
1.8 |
|
Imports |
2.0 |
0.7 |
0.0 |
0.1 |
1.4 |
|
GDP |
1.9 |
1.6 |
1.2 |
1.0 |
1.8 |
|
Consumer prices |
1.9 |
2.4 |
2.0 |
2.0 |
2.2 |
|
Real disp income |
2.2 |
4.5 |
1.9 |
0.4 |
1.4 |
|
H’hold sav. Ratio2 |
3.7 |
6.0 |
5.0 |
4.0 |
4.0 |
|
Employment |
1.3 |
1.9 |
1.3 |
0.4 |
1.1 |
|
Unemployment |
6.7 |
6.4 |
6.9 |
7.1 |
6.4 |
|
Interest rate4 |
0.98 |
2.25 |
2.25 |
1.75 |
2.25 |
|
Federal gov’t bal.1 |
-2.1 |
-1.6 |
-2.5 |
-2.3 |
-2.0 |
|
Current account1 |
-2.2 |
-0.5 |
-1.7 |
-1.8 |
-1.7 |
|
Sources: Refinitiv, Capital Economics. 1) As a % of GDP, 2) As a % of disposable income, 4) Bank of Canada overnight target rate (end of period). |
|||||
Canada Charts
|
|
|
|
|
|


|
|
|
|
|
|


|
|
|
|
|
|


|
|
|
|
|
|
|
Sources: LSEG, Capital Economics. |


Australia & New Zealand
A tale of two recoveries
- The Australian economy bounced back strongly in Q2, and it increasingly appears that the recovery has legs. In contrast, the New Zealand economy remains mired in a deep slump, and we believe that it will be some time before growth returns to trend. (See Chart 49.) Against this backdrop, we expect the RBA to shift policy towards a neutral stance, while the RBNZ moves further into expansionary territory.
- Australia’s real GDP grew by a solid 0.6% q/q in Q2, as consumers opened up their wallets. Our GDP Nowcast suggests that the economy will have expanded by a healthy 0.5% q/q in Q3 as well. (See Chart 50.) In contrast, New Zealand’s economy contracted by a whopping 0.9% q/q last quarter. There are tentative signs that the worst is behind us. That said, card transactions data point to only a modest pick-up in activity in Q3. (See Chart 51.)
- A key factor weighing down the recovery in New Zealand is the weak property sector. (See here.) Indeed, house prices fell again in August, leaving them 0.5% below levels from a year earlier. With home sales also edging lower in recent months, we suspect the housing rebound won’t take off until well into next year. (See Chart 52.) Meanwhile, Australia’s housing market has already turned the corner, and we suspect the ongoing rally has further to run.
- Australia’s unemployment rate has drifted up a bit since the start of the year. However, at 4.2% presently, it remains low by historical standards. Moreover, with activity firming up, we don’t expect the labour market to loosen much further. (See Chart 53.) Across the ditch, New Zealand’s jobless rate is also close to peaking, albeit at a nine-year high. We suspect that the path back to pre-pandemic levels will be a drawn out one.
- Wage growth in Australia has remained stubbornly above 3% in recent quarters. However, our composite labour market index points to a slowdown in the coming quarters. (See Chart 54.) Meanwhile, wage growth in New Zealand plunged to a fresh low of 2.2% in Q2 and is likely to fall even further.
- Australia’s trimmed mean inflation fell to 2.7% in Q2. However, with the output gap having all but closed and the recovery starting to firm up, we suspect disinflation has largely run its course. In contrast, core inflation has further to fall in New Zealand and is likely to briefly undershoot the mid-point of the RBNZ’s 1-3% target band next year. (See Chart 55.)
- With the RBA mindful of stoking capacity pressures, we have revised up our forecast for the terminal cash rate from 2.85% to 3.10%. The considerations are decidedly different for the RBNZ, which is increasingly concerned about the weak state of the economy. Accordingly, we now see rates in New Zealand bottoming out at 2.25%, down from 2.5% previously. (See Chart 56.)
|
Table 8: Australia & New Zealand Forecasts (%y/y unless stated) |
|||||
|
Avg. |
Forecasts |
||||
|
13-23 |
2024 |
2025 |
2026 |
2027 |
|
|
Australia |
|||||
|
GDP |
2.4 |
1.0 |
1.7 |
2.1 |
2.5 |
|
Unemployment1 |
5.3 |
4.0 |
4.2 |
4.3 |
4.3 |
|
Consumer prices2 |
2.9 |
3.2 |
2.6 |
2.7 |
2.6 |
|
RBA cash rate3 |
1.6 |
4.35 |
3.35 |
3.10 |
3.10 |
|
Gen’l gov’t bal4 |
-2.1 |
-0.4 |
-1.1 |
-1.2 |
-1.8 |
|
Current account4 |
-2.0 |
-1.9 |
-1.9 |
-1.4 |
-1.6 |
|
New Zealand |
|||||
|
GDP |
3.1 |
-0.6 |
0.2 |
2.5 |
3.3 |
|
Unemployment1 |
4.5 |
4.8 |
5.2 |
5.2 |
4.8 |
|
Consumer prices2 |
2.6 |
2.9 |
2.8 |
2.0 |
1.9 |
|
RBNZ cash rate3 |
2.16 |
4.25 |
2.25 |
2.25 |
2.75 |
|
Gen’l gov’t bal4 |
-0.9 |
-3.6 |
-3.8 |
-2.7 |
-1.5 |
|
Current account4 |
-4.0 |
-4.7 |
-3.2 |
-2.7 |
-3.6 |
|
Sources: Refinitiv, Capital Economics. 1) Unemployment rate, 2) Year average, 3) End-year, 4) As a % of GDP |
|||||
Australia & New Zealand Charts
|
|
|
|
|
|


|
|
|
|
|
|
|
|
|
|
|
|
|
|
|
|


 f
f|
|
|
|
|
|
|
Sources ABS, Cotality, LSEG, REINZ, RBA, RBNZ, StatsNZ, Capital Economics. |


China
Growth weak but stable
- The gap between our China Activity Proxy measure of growth and official GDP is one of the widest on record. (See Chart 57.) While exports will continue to prove resilient in the face of US tariffs, growth is set to remain weak.
- China’s economy is growing at a far slower pace than official figures suggest, but it hasn’t slowed since the start of the year That’s partly because exports have held up well despite US tariffs. But it’s also because services sector growth, which had been weakening steadily for some time, has picked up in recent months on the back of stronger financial sector activity. (See Chart 58.) We’re forecasting further gains in Chinese equities both this year and next. That will help boost financial sector activity and may result in some positive wealth effects.
- The leadership finally appears ready to do more to support households, with several new measures announced recently. This could in time prove a significant turning point. The Finance Minister’s recent comment that “more public services will be brought under the scope of investment support” could also indicate that local governments may soon be able to issue special bonds for social spending. But with the labour market softening, the measures announced so far won’t do more than keep consumption growth stable.
- Indeed, while the fiscal stance will remain accommodative, the tailwind from fiscal easing will fade over the next year. (See Chart 59.) We’re also expecting only modest further monetary easing. (See Chart 60.)
- And the country’s overcapacity issue seems set to persist. The government’s campaign against “involution-style” competition may curb investment in some sectors, but policymakers won’t pursue an abrupt pullback in manufacturing investment while property is still declining and options for effective infrastructure spending are limited. (See Chart 61.) Without a meaningful boost to consumption, China’s capacity glut means that supply will still outstrip demand for some time, keeping the economy in deflation. (See Chart 62.)
- Excess capacity will also continue to drive exports. (See Chart 63.) While tariffs have resulted in a sharp fall in exports to the US, a trade-weighted depreciation of the renminbi (see Chart 64) has helped exporters gain market share elsewhere. We’re forecasting a slight strengthening of the renminbi against the dollar, but the trade-weighted currency will remain weaker than its pre-Liberation Day level.
- And as supply-chains in other countries adjust to US tariffs, we expect trade diversion to pick up further. That said, exports won’t expand as rapidly as they have in recent years. (See Chart 63 again). As a result, exports will provide a still significant but smaller prop to growth.
- In short, while the government is taking some positive steps to support households, the scale of the recent measures is too small to give a significant boost to consumption. China will still rely heavily on investment and external demand to drive growth. We expect growth of just 3% over the rest of this year and into next.
|
Table 9: China Key Forecasts (% y/y unless stated) |
|||||
|
Ave. |
Forecasts |
||||
|
2014-23 |
2024 |
2025 |
2026 |
2027 |
|
|
GDP (CAP-based)1 |
5.3 |
4.5 |
3.0 |
3.0 |
2.8 |
|
GDP (Official) 1 |
7.8 |
5.0 |
4.8 |
4.3 |
3.8 |
|
Consumer Prices1 |
1.8 |
0.3 |
-0.1 |
-0.1 |
0.1 |
|
Policy Rate2 |
2.40 |
1.50 |
1.30 |
1.10 |
1.00 |
|
Exchange Rate2,3 |
6.59 |
7.30 |
7.10 |
7.00 |
6.80 |
|
Gen’l gov’t bal 4 |
-4.1 |
-4.8 |
-5.3 |
-6.7 |
-7.1 |
|
Current Account4 |
1.6 |
2.5 |
3.5 |
4.0 |
3.0 |
|
Sources: Capital Economics. 1) Annual Avg., 2) end-period, 3) vs. US$, 4) % of GDP |
|||||
China Charts
|
|
|
|
|
|


|
|
|
|
|
|


|
|
Chart 62: Consumer Prices (% y/y) |
|
|
|


|
|
|
|
|
|
|
Sources: CEIC, WIND, LSEG, Capital Economics. |


India
Economic resilience amid US tariff hit
- After an exceptionally strong first half of 2025, India’s economy faces a more challenging rest of this year and 2026 in the face of punitive US tariffs. But tariffs could get rolled back and, even if they don’t, India will remain a relative bright spot in the global economy. Inflation has probably bottomed out but will rise only gradually back towards the RBI’s 4% target over the coming months. That leaves scope for the RBI to cut the repo rate by a further 50bps this year, taking it down to 5.00%.
- GDP growth accelerated from 7.4% y/y in Q1 to 7.8% y/y in Q2, a five-quarter high. Household consumption and government spending have been particularly strong points.
- But things are now getting tougher. The biggest headwind is the punitive tariffs on exports to the US – partly “reciprocal”, and partly because of India’s purchases of Russian oil. Now standing at 36%, taking product exclusions into account, the US effective tariff rate on India is one of the highest in the world. (See Chart 65.)
- India is not very dependent on final US demand: we estimate that it drives 2% of India’s GDP. (See Chart 66.) But a tariff rate that high leaves India uncompetitive vis-à-vis other parts of Asia, which would be enough to materially impact activity in the near term.
- It is still possible that the tariff rate gets rolled back at some stage. But the mood is shifting the other way. Talks between US and Indian trade officials have ceased for now. And timely data show that India hasn’t meaningfully reduced its purchases of Russian oil.
- That said, helping to cushion the blow is the implicit fiscal loosening that will result from the streamlining of Goods and Services Tax (GST) rates. That will effectively slow the pace of fiscal consolidation. (See Chart 67.)
- And helping to boost household consumption is very low inflation. The headline rate is unlikely to rise back to the 4% target until mid-2026. (See Chart 68.)
- Recent monetary easing – the repo rate has been trimmed by 100bps since February – should also support domestic demand. And the weakness of inflation gives the central bank scope to loosen further. We expect another 50bps of cuts over the next few months, taking the repo rate down to 5.00%. (See Chart 69.)
- Putting all this together, and given the strong starting point, we continue to expect GDP growth of 7.0% in 2025, but we have revised down our growth forecast for 2026 to 6.5% (from 7.0% previously). (See Chart 70.) These rates of growth are still enviable by global standards and would leave India on course to overtake Japan and Germany to become the world’s third-largest economy well before the end of the decade. (See Chart 71.)
- On the external front, if the US tariffs remain in place, the current account deficit will widen, not least because Indian firms will struggle to redirect their exports to non-US markets amid tough competition from China.
- However, the subdued outlook for global oil prices should help to keep the overall deficit within the 2% of GDP threshold that the RBI deems sustainable. (See Chart 72.)
|
Table 10: India Key Forecasts (% y/y unless stated) |
|||||
|
Avg. |
Forecasts |
||||
|
2014-23 |
2024 |
2025 |
2026 |
2027 |
|
|
GDP |
6.1 |
6.7 |
7.0 |
6.5 |
6.5 |
|
Consumer Prices1 |
5.2 |
4.9 |
3.6 |
4.6 |
4.7 |
|
RBI Repo Rate2 |
5.95 |
6.50 |
5.25 |
5.00 |
5.50 |
|
Cent’l Gov’t Bal3,4 |
-5.0 |
-5.6 |
-4.8 |
-4.4 |
-4.2 |
|
Current Account4 |
-1.1 |
-0.8 |
-0.6 |
-1.5 |
-1.5 |
|
Sources: LSEG, Capital Economics. 1) Annual average, 2) End-year, 3) End of Fiscal Year, Excl. State Deficits 4) % of GDP, 4Q sum |
|||||
India Charts
|
|
|
|
|
|
 Indi
Indi
|
|
|
|
|
|


|
|
|
|
|
|


|
|
|
|
|
|
|
Sources: |


- Further subdued economic growth lies in store for most of Asia over the rest of this year and to the end of 2026 as tighter fiscal policy and softer exports weigh on demand. (See Chart 73.) With inflation very low, central banks are likely to cut interest rates further.
- Consumption, supported by low inflation and recent interest rate cuts, will remain a relative bright spot for the region. But growth is still set to struggle in the face of other headwinds. Fiscal policy is being tightened as countries continue to seek to bring deficits and debt back to more sustainable levels following the pandemic. (See Chart 74.)
- Exports have grown strongly this year (see Chart 75) but are likely to soften against the backdrop of weaker growth in the US and subdued demand from China. Most countries in Asia have been hit with US tariffs of around 15-20% on their exports to the US (China and India are the key exceptions). This will act as a further drag, although the impact should be manageable.
- For one, most countries face similar tariff rates (see Chart 76), so competitiveness relative to non-US producers should remain largely unchanged. In addition, there could be some offsetting benefits for the rest of Asia as US buyers look to shift sourcing away from China (and India), which have been hit by much higher tariffs. Countries whose export baskets most closely match China’s (see Chart 77) and which have spare production capacity stand to gain the most. Vietnam, which has so far been the biggest beneficiary of US-China decoupling (see Chart 78) is one country that stands out.
- Inflationary pressures remain weak. Thailand and China are in deflation, while headline rates are below 2% in several countries, including Korea, Malaysia and the Philippines. (See Chart 79.) Persistent industrial overcapacity is likely to keep China in or near deflation over the next couple of years. This overcapacity will also weigh on goods prices across the region. And with growth set to struggle, domestically generated price pressures will remain low.
- Nonetheless, headline inflation should rise soon as less favourable base effects put upward pressure on food and energy prices. Meanwhile, recent reductions in utility bills in Thailand are likely to have only a temporary effect, and we anticipate inflation there will return to positive territory later this year.
- This leaves the region’s central banks in a relatively strong position: China aside, persistent deflation should be avoided, while inflation will remain low. This should give them room to continue gradual easing cycles in order to support economic growth.
- We expect most central banks to cut rates by a further 50–125 basis points between now and the end of next year. (See Chart 80.)
|
Table 11: Selected Other Asia (% y/y) |
|||||||||
|
World Share1 |
GDP |
Consumer Prices |
|||||||
|
2024 |
2025 |
2026 |
2027 |
2024 |
2025 |
2026 |
2027 |
||
|
Asia2 |
11.2 |
4.1 |
3.9 |
4.1 |
4.0 |
4.1 |
2.4 |
3.0 |
2.9 |
|
Indonesia |
2.4 |
5.0 |
5.0 |
5.0 |
5.0 |
2.3 |
2.0 |
3.0 |
2.8 |
|
Philippines |
0.7 |
5.6 |
5.3 |
6.5 |
6.3 |
3.2 |
1.6 |
2.5 |
3.0 |
|
South Korea |
1.7 |
2.0 |
0.5 |
1.5 |
1.7 |
2.3 |
1.9 |
2.1 |
1.9 |
|
Thailand |
0.9 |
2.5 |
2.5 |
2.4 |
2.4 |
0.4 |
0.2 |
1.0 |
1.1 |
|
Sources: LSEG, Capital Economics. 1) Share of World GDP in 2024 PPP terms. 2) Excluding China and India. |
|||||||||
Other Asia Charts
|
Chart 73: GDP (% y/y) |
Chart 74: Budget Balance (% of GDP) |
|
|
|


|
Chart 75: Asian Exports (US$, % y/y) |
Chart 76: Headline US Tariff Rates (%) |
|
|
|


|
Chart 77: Export Similarity Index (Maximum Score = 100) |
Chart 78: Share of US Imports by Source |
|
|
|


|
Chart 79: Consumer Prices (latest, % y/y) |
Chart 80: Forecast Change in Policy Rate |
|
|
|
|
Sources: LSEG, CEIC, BIS, Capital Economics. |


Emerging Europe
Stagnation in Russia, fragile recoveries in CEE
- The economies of Emerging Europe will diverge over the coming year as Russia’s war economy continues to run out of steam, while growth in CEE picks up. Falling inflation and slower wage growth will pave the way for further monetary easing in most countries, but continued labour market tightness will mean that interest rates generally remain higher than most expect.
- GDP growth across the region generally held up well in Q2 following the imposition of US tariffs. Turkey recorded particularly strong growth, while most of CEE saw a modest acceleration. That said, conflicts affected the economies of Russia and Israel. (See Chart 81.)
- We think Russia’s economy will do little more than stagnate over the coming quarters as high interest rates keep credit growth weak and non-war fiscal policy is tightened.
- In CEE, survey data suggest that regional growth has stayed resilient in Q3. (See Chart 82.) Dependence on the US as an export destination is low, which will limit the impact of US tariffs. What’s more, exports will be supported by a modest pick-up in growth in Germany next year as fiscal stimulus kicks in. (See Chart 83.)
- That said, the region will follow diverging paths. We think Poland will continue to outperform, and that Hungary’s economy will return to growth, but weak investment will limit any rebound there. And Romania will be held back by fiscal tightening. (See Chart 84.)
- In most countries, public debt ratios will remain on an upward trajectory. While Czechia’s public finances are starting from a position of strength and could accommodate a small fiscal loosening, budget deficits elsewhere remain wide. (See Chart 85.) Fiscal slippage risks putting upward pressure on bond yields.
- In Turkey, the crackdown on President Erdogan’s political opponents this year has raised concerns about a further shift towards autocracy. While we expect the orthodox macroeconomic policy programme to remain in place, the rebalancing of the economy will continue to be bumpy and we expect the lira to fall significantly further (~25% against the dollar) by the end of next year. (See Chart 86.)
- Wage growth has slowed across the region this year and inflation has generally fallen, which is a welcome development for central banks. But price pressures are still too strong for comfort. Forward-looking indicators suggest that services inflation is unlikely to fall much further in CEE. We expect inflation will ease in most countries by end-2026, but it is likely to stay close to the top of or above target ranges. (See Chart 87.)
- Interest rates will be cut in most countries over the coming year, but tight labour markets will mean policymakers tread cautiously. We generally expect less monetary easing than other analysts by end-2026. (See Chart 88.)
|
Table 12: Emerging Europe Key Forecasts (% y/y) |
|||||||||
|
World Share1 |
GDP |
Consumer Prices |
|||||||
|
2024 |
2025 |
2026 |
2027 |
2024 |
2025 |
2026 |
2027 |
||
|
Emerging Europe2 |
8.4 |
3.2 |
2.0 |
1.9 |
2.2 |
6.4 |
7.1 |
4.7 |
4.1 |
|
Russia |
3.6 |
4.3 |
0.7 |
0.5 |
1.0 |
8.5 |
8.7 |
5.3 |
4.8 |
|
Turkey |
1.8 |
3.3 |
3.8 |
3.0 |
3.0 |
58.5 |
34.3 |
24.0 |
18.3 |
|
Poland |
1.0 |
2.9 |
3.0 |
3.3 |
3.0 |
3.6 |
3.8 |
3.3 |
3.3 |
|
Czechia |
0.3 |
1.2 |
2.5 |
2.8 |
2.8 |
2.4 |
2.7 |
2.5 |
2.3 |
|
Hungary |
0.2 |
0.5 |
0.5 |
2.0 |
2.5 |
3.7 |
4.6 |
3.8 |
3.3 |
|
Sources: LSEG Data & Analytics, Capital Economics. 1) Share of World GDP in 2024 PPP terms. 2) Inflation measure excluding Turkey |
|||||||||
Emerging Europe Charts
|
|
|
|
|
|


|
|
|
|
|
|


|
|
|
|
|
|


|
|
|
|
|
|
|
Sources: LSEG, EC, FocusEconomics, Capital Economics. |


Latin America
Slowdown sets the stage for dovish surprises
- Growth in Latin America will be weaker than most expect next year which underpins our view that inflation and interest rates will be lower than is widely anticipated.
- Latin American GDP growth slowed in Q2. But there were big differences at a country level. While growth eased in Brazil and Argentina, activity picked up elsewhere, including Mexico. (See Chart 89.) Mexico’s economy has performed better than expected thanks to tariff exemptions for USMCA-compliant goods and a surge in AI-related products.
- Elsewhere in the region, the hit from tariffs is likely to be limited. Most countries don’t have large trade ties with the US and there have been significant carve-outs for key exports (civilian aircrafts and most mining products in Brazil and refined copper in Chile and Peru). Instead, other factors pose a bigger headwind to the growth outlook. For one thing, wage growth and remittances are slowing. And we expect the prices of Latin America’s key export commodities to fall, which will weigh on incomes and export earnings. (See Chart 90.)
- Taken together with fiscal tightening, we expect aggregate Latin American GDP growth to slow to just 1.7% next year – in contrast to consensus expectations for growth to stabilise at over 2%. Our forecasts across the region lie below the consensus. (See Chart 91.)
- Weak growth should support the disinflation process. Inflation is already back within target ranges in Mexico and Peru and we expect it to return to target (early) next year in Chile and Brazil. (See Chart 92.) Colombia aside, our interest rate forecasts lie on the dovish side, particularly in Brazil. (See Chart 93.)
- Fiscal problems are a key risk to this view. Although governments are tightening fiscal policy and budget deficits have started to narrow, this is coming from a weak starting point, especially in Brazil and Colombia. A shift to the right in upcoming elections would probably lead to tighter fiscal policy than is currently the case. But incumbents could loosen the purse strings ahead of elections. And even more market-friendly governments will struggle to solve the region’s fiscal woes, particularly in light of lower commodity prices. Public debt ratios are likely to continue to trend higher in most countries. (See Chart 94.)
- The recent improvement in external balance sheets has been a key factor supporting Latin American currencies. But that’s changing amid a surge in imports. Lower commodity prices will cause current account positions to deteriorate further. (See Chart 95.)
- Widening current account deficits, elevated fiscal risks and lower commodity prices underpin our forecast for the region’s currencies to depreciate. (See Chart 96.)
|
Table 13: Latin America Key Forecasts (% y/y) |
|||||||||
|
World |
GDP |
Consumer Prices |
|||||||
|
2024 |
2025 |
2026 |
2027 |
2024 |
2025 |
2026 |
2027 |
||
|
Latin America2 |
6.7 |
2.1 |
2.2 |
1.7 |
1.8 |
4.4 |
4.2 |
3.7 |
3.5 |
|
Brazil |
2.4 |
3.4 |
2.3 |
1.5 |
1.5 |
4.4 |
5.1 |
4.3 |
4.0 |
|
Mexico |
1.7 |
1.4 |
0.5 |
1.0 |
1.5 |
4.7 |
3.5 |
3.5 |
3.8 |
|
Argentina |
0.7 |
-1.3 |
4.5 |
2.3 |
2.3 |
220 |
42 |
27 |
21 |
|
Colombia |
0.6 |
1.6 |
2.3 |
2.0 |
2.3 |
6.6 |
5.0 |
4.3 |
3.8 |
|
Chile |
0.3 |
2.6 |
2.3 |
2.0 |
2.0 |
4.3 |
4.3 |
3.3 |
3.0 |
|
Sources: LSEG, Capital Economics. 1) Share of World GDP in 2023 PPP terms. 2) Regional GDP excl. Venezuela; regional CPI excl. Argentina & Venezuela. |
|||||||||
Latin America Charts
|
|
|
|
|
|


|
|
|
|
|
|


|
|
|
|
|
|


|
|
|
|
|
|
|
Sources: LSEG, FocusEconomics, National Central Banks, Capital Economics. |


Middle East and North Africa
Regional pick up, but divergence under the surface
- GDP growth across the region is likely to pick up as the Gulf economies ramp up oil output, but fiscal policy will weigh on non-oil sectors.
- Gulf economies are being boosted by OPEC+’s shift in oil policy towards regaining market share. Output is up 5% since Q1 and the group will begin to unwind the second tranche of cuts in Q4. We expect oil output to rise by 10% across the Gulf by end-2026 (see Chart 97), but this boost to GDP growth will fade over 2026.
- We think that higher supply will lead to Brent crude oil sliding back to $60pb and $50pb by end-25 and end-26 respectively. We also project global LNG prices to fall. (See Chart 98.) The upshot for the Gulf is that, despite higher output volumes, oil export receipts will weaken, leading to a deterioration in current account and budget balances. (See Chart 99.) Qatar is the exception as the North Field LNG project starts to come online from mid-2026.
- Strong balance sheets mean that this is not a problem for the UAE, Kuwait, and Qatar and fiscal policy should remain supportive. In contrast, a period of fiscal consolidation lies in store for Saudi, Bahrain, and Oman.
- Interest rates in the Gulf will come down in line with the US Fed’s moves. (See Chart 100.) This may provide some boost to credit demand. But historically, periods of low oil prices have tended to coincide with weak credit growth, irrespective of the level of interest rates.
- Outside of the Gulf, we expect strong growth in Egypt and Morocco. The former will be supported by improved competitiveness and lower interest rates. We expect inflation to fall to within the central bank’s target range in Q1. This provides lots of scope for monetary easing and we are more dovish than the consensus in expecting 1,100bp of cuts by end-26. (See Chart 101.) Morocco’s economy should be bolstered by tourism and vehicle output.
- All told, we expect the region’s GDP to grow by 4.0% in 2025 and 4.3% in 2026 – which is above consensus. (See Chart 102.)
- Current account deficits have widened in recent quarters in the non-Gulf economies (see Chart 103) but we don’t see this as a major concern in most places. In Jordan, easing geopolitical tensions and returning tourists should aid exports. Egypt’s deficit has begun to narrow.
- Morocco’s external position remains strong. This should allow officials to widen the dirham’s trading band. In the event, we expect a slight appreciation over 2026-27.
- We are most concerned about Tunisia. FX reserves are perilously low after being used to service external debts. Officials are likely to face a choice between meeting repayments (see Chart 104) or supporting the dinar and meeting import demand. Without foreign assistance, the threat of a messy balance of payments crisis and sovereign debt crisis is likely to build.
|
Table 14: Middle East and North Africa Key Forecasts (% y/y) |
|||||||||
|
World Share1 |
GDP |
Consumer Prices |
|||||||
|
2024 |
2025 |
2026 |
2027 |
2024 |
2025 |
2026 |
2027 |
||
|
MENA |
4.1 |
2.6 |
4.0 |
4.3 |
4.5 |
10.0 |
5.4 |
3.3 |
3.8 |
|
Saudi Arabia |
1.3 |
2.0 |
4.3 |
4.0 |
3.0 |
1.7 |
2.0 |
0.8 |
1.8 |
|
Egypt |
1.0 |
3.1 |
4.5 |
5.5 |
6.3 |
28.0 |
13.5 |
7.3 |
8.0 |
|
UAE |
0.5 |
4.0 |
6.0 |
4.5 |
3.8 |
1.8 |
1.0 |
0.8 |
0.5 |
|
Morocco |
0.2 |
3.8 |
4.0 |
4.5 |
5.0 |
0.9 |
1.0 |
2.0 |
2.3 |
|
Sources: LSEG, CEIC, Capital Economics. 1) Share of World GDP in 2024 PPP terms. |
|||||||||
Middle East and North Africa Charts
|
|
|
|
|
v |


|
|
|
|
|
|


|
|
|
|
|
|


|
|
|
|
|
|
|
|
Sources: CEIC, Refinitiv, Capital Economics. |


Sub-Saharan Africa
Looser monetary policy, stronger growth
- Growth across Sub-Saharan Africa is set to pick up over the next couple of years helped by a more stable macro environment, lower inflation and looser monetary policy. Debt fears are fading for many, although sovereign default concerns will linger in the likes of Angola, Mozambique and Kenya.
- Recent data show GDP growth picked up across the region in the first half of the year. And more timely indicators suggest this momentum will be maintained over the remainder of the year. (See Chart 105.)
- Shifts in terms of trade will be mixed over 2026-27. (See Chart 106.) Lower oil prices will benefit energy importers but hurt exporters such as Angola and Nigeria. Gains from high cocoa prices in Ghana and Côte d’Ivoire are fading (See Chart 107), but the former will benefit from strong gold exports.
- Zambia’s copper output is surging, but softer global prices will weigh on revenues. Demand for other industrial metals is likely to suffer amid weakness in China’s property sector. US protectionism is less of a concern, although the imminent expiry of the preferential trading scheme AGOA will weigh on South Africa’s auto sector and Kenya’s textile industry.
- For most, balance of payments strains will remain contained, with more competitive currencies reducing the risk of a repeat of the sharp depreciations of recent years. (See Chart 108.) That will help to keep inflation low or falling (see Chart 109) and suggests the region’s central banks have scope to cut interest rates (see Chart 110) quicker and deeper than most other analysts expect.
- Overall, the macroeconomic backdrop for Sub-Saharan Africa looks its most favourable in years, with sovereign risk premia currently near pre-pandemic levels. (See Chart 111.) We expect growth to pick up from 3.9% this year to 4.5% by 2027. (See Chart 112.)
- But vulnerabilities remain. Angola faces tight fiscal constraints as oil revenues decline and resistance to austerity builds. Kenya is also struggling with fiscal consolidation and is scrambling for external financing to plug its budget shortfall. Mozambique resolving its debt distress challenges continues to be tied to its long-awaited gas megaprojects. And elections in Côte d’Ivoire, Tanzania and Uganda in the coming months risk social unrest that could dent investor sentiment.
- The region’s evolving relationship with China also poses challenges. The recent surge in Chinese exports may bring benefits through lower inflation. But it also risks undermining industrialisation efforts, especially in low value-added sectors such as textiles where the likes of Kenya are seeking to gain a foothold. And deeper relations with China risks aggravating tensions with the US.
|
Table 15: Selected Sub-Saharan Africa Key Forecasts (% y/y) |
|||||||||
|
World Share1 |
GDP |
Consumer prices |
|||||||
|
2024 |
2025 |
2026 |
2027 |
2024 |
2025 |
2026 |
2027 |
||
|
Sub-Saharan Africa |
2.4 |
3.8 |
3.9 |
4.3 |
4.4 |
17.3 |
12.5 |
9.8 |
8.8 |
|
Nigeria |
0.8 |
3.4 |
3.5 |
3.8 |
3.8 |
33.2 |
21.0 |
14.5 |
12.5 |
|
South Africa |
0.6 |
0.5 |
1.3 |
2.0 |
1.8 |
4.5 |
3.0 |
3.5 |
3.8 |
|
Angola |
0.1 |
4.4 |
2.3 |
0.5 |
0.5 |
28.2 |
20.5 |
16.5 |
14.0 |
|
Kenya |
0.2 |
4.3 |
4.8 |
4.8 |
5.0 |
4.5 |
4.8 |
5.5 |
5.3 |
|
Sources: Refinitiv, IMF, NBS, Stats SA, INE, KNBS, National Sources, Capital Economics. 1) Share of World GDP in 2023 PPP terms. |
|||||||||
Sub-Saharan Africa Charts
|
|
|
|
|
|


|
|
|
|
|
|


|
|
|
|
|
|


|
(Latest = Q2 2025) |
|
|
|
|
|
Sources: LSEG, CEIC, Capital Economics. |


