Reopening recovery to shift down a gear
Q2 China Economic Outlook
Below are excerpts from our latest quarterly China Economic Outlook. Access to the complete report, including extensive forecasts and near to long-term analysis, is available as part of a subscription to our CE Advance premium product or to our dedicated China Economics coverage.
Reopening recovery to shift down a gear
Much of the economic boost from China’s reopening has already happened. While there is still some upside to consumer and services activity, weakened balance sheets and limited policy support mean the recovery will probably fizzle out by year-end.
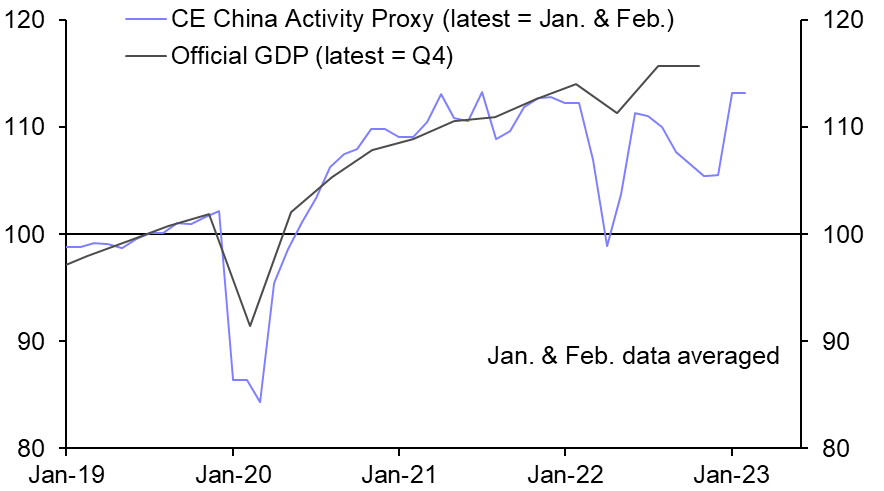
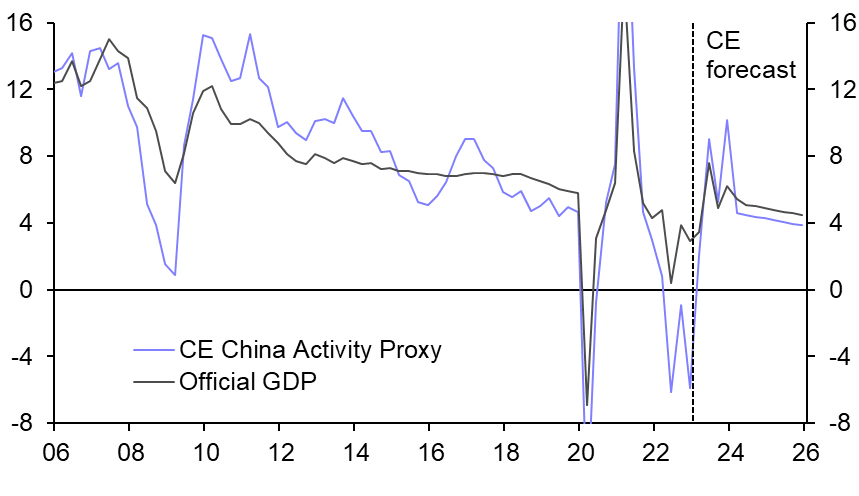
- The economy ended 2022 in the doldrums, as lockdowns gave way to a disruptive surge of infections. Official GDP was stable in Q4. But other indicators, including our China Activity Proxy (CAP), pointed to a deep contraction.
- The situation turned a corner at the start of this year, with the CAP showing a jump in activity in January and February as the pivot away from zero-COVID began to pay off. (See Chart 1.)
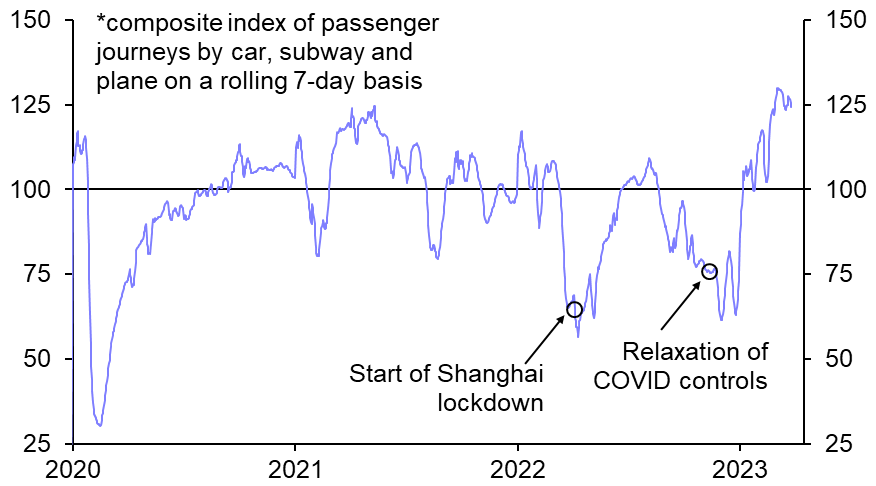
- The recovery will be slower from here on given that much of the immediate boost from reopening has happened. Mobility was already back to normal by February. (See Chart 2.)
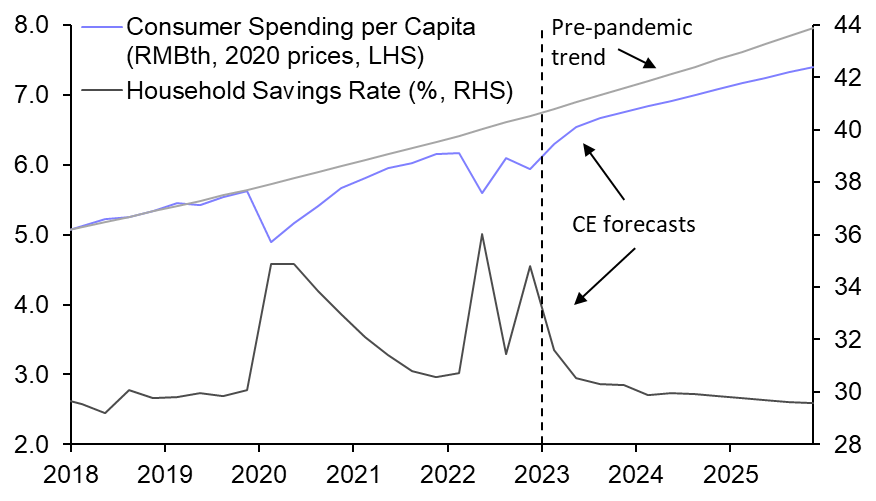
- But while consumers have returned to the streets, they have yet to fully reopen their wallets. We think that will change as labour market conditions improve and the savings rate drops back to normal levels. (See Chart 3.) The in-person services that were hardest hit by the pandemic, such as travel and catering, stand to benefit most from this.
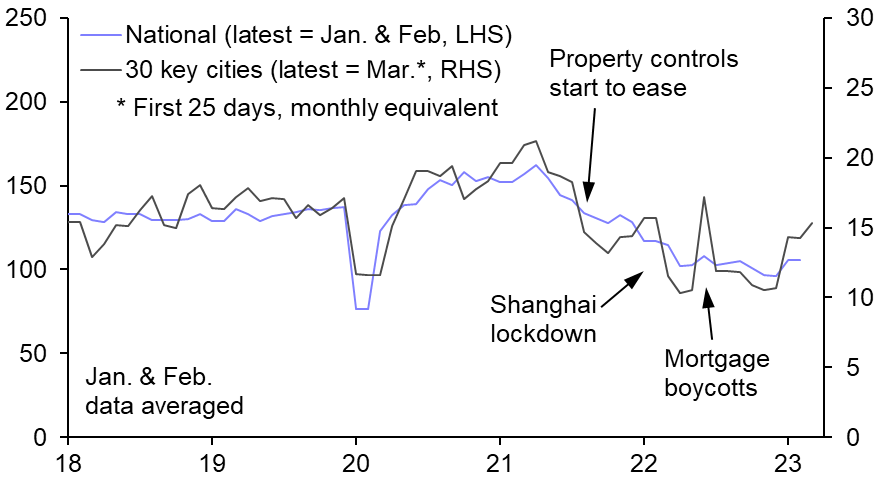
- We also think that the recent uptick in new home sales (see Chart 4) marks the start of a turnaround in the housing market. The decline in sales last year went well beyond what is justified by structural headwinds, suggesting that there is room for a cyclical recovery.
| Chart 1: Official GDP & CE China Activity Proxy (2019 = 100, seas. adj.) |
Chart 2: CE China Mobility Tracker (% of 2019, 7d ave.) |
 |
 |
| Chart 3: Household Consumption & Saving | Chart 4: New Home Sales (million sqm, seas. adj.) |
 |
 |
| Sources: CEIC, Refinitiv, WIND, Capital Economics |
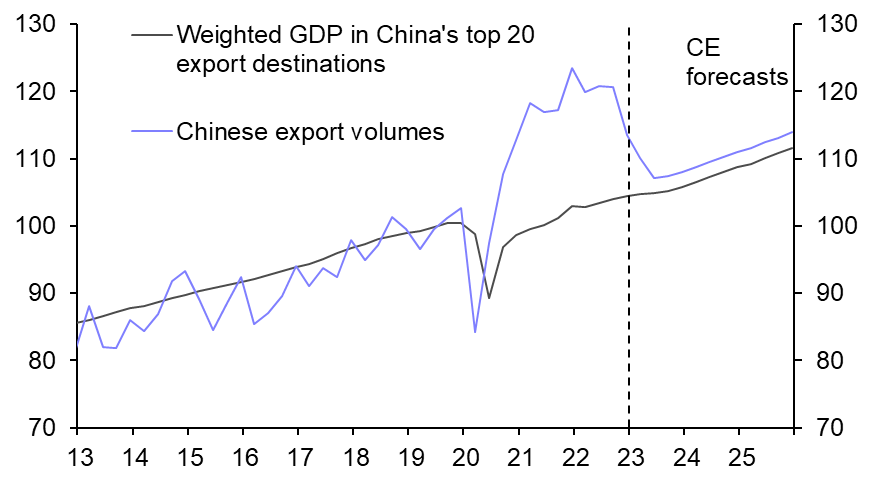
- Although near-term economic prospects are brighter than they have been in a while, there are still plenty of constraints on the recovery. First, the export sector faces a hangover from its pandemic-induced boom. The weak global backdrop will make matters worse. Tighter credit conditions following recent banking sector strains have dented the outlook for the US and euro-zone. As such, while there will be pockets of strength, including EVs, exports still look set to contract this year. (See Chart 5.)
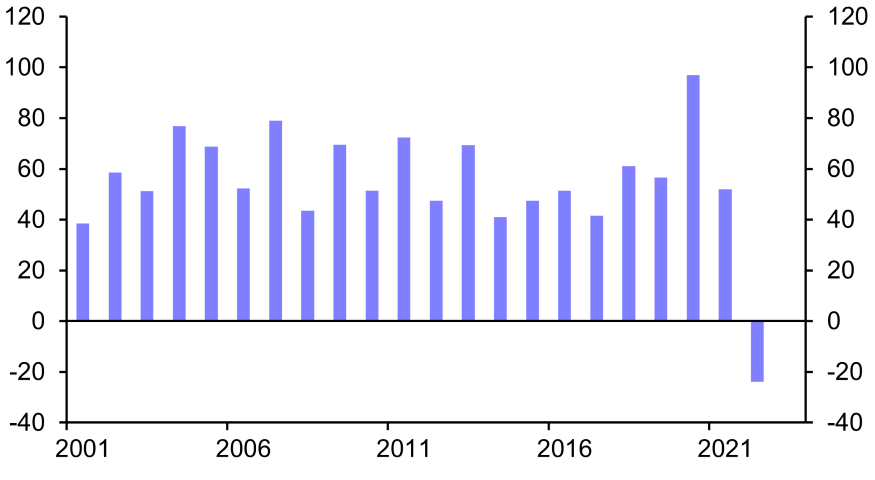
- Second, the upside to consumer spending will be capped by balance sheet effects. While deposits held by household have jumped, that reflects a shift out of riskier assets not stronger household finances. To the contrary, household net wealth fell outright last year amid declines in home and equity prices. (See Chart 6.) Consumers will be focused on rebuilding wealth not running down accumulated savings.
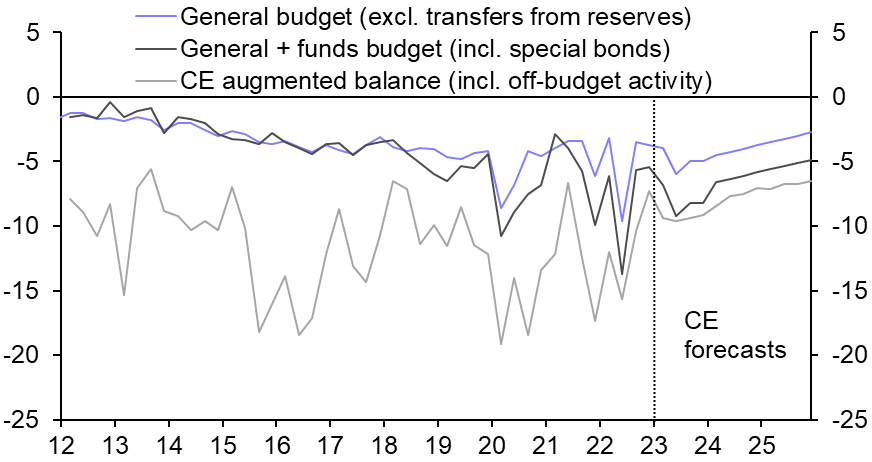
- Lastly, there will be fewer policy tailwinds compared to previous economic upswings. The annual budget points to little additional fiscal support this year. Front-loading means spending will strengthen somewhat during the first half of the year. But the fiscal stance will tighten again before long. (See Chart 7.)
- Meanwhile, last year’s easing bias appears to be giving way to a more neutral monetary stance. A revival in credit demand following reopening means that lending will pick up in the near-term. But it may bump up against regulatory controls before long, as policymakers turn their attention to defusing financial risks.
- All told, the sizeable boost from reopening and a flattering base for comparison means that growth should exceed the government’s 5.0% target this year. But given policy restraint and the absence of external tailwinds, the recovery will probably fizzle out by year-end, with the structural decline in China’s growth rate becoming visible again next year. (See Chart 8.)
| Chart 5: Exports & Trade Partner GDP (2019 = 100, SA) |
Chart 6: Change in Household Net Wealth (% of GDP) |
 |
 |
| Chart 7: Fiscal Balance (% of GDP) | Chart 8: Official GDP & CE China Activity Proxy (% y/y) |
 |
 |
| Sources: CEIC, Refinitiv, WIND, Capital Economics |
This content is based on a report for Capital Economics clients written by Julian Evans-Pritchard, Sheana Yue and Zichun Huang published on 29th March, 2023.

Make faster informed decisions
CE Advance, our new premium product, equips organisations with actionable macroeconomic data and insight to stay ahead of the curve.