The pullback in gold prices over the past week shouldn’t have come as a surprise. The yellow metal has been on such an extraordinary tear this year that it had become even more unmoored from any fundamental valuations and so was ripe for a sharp correction.
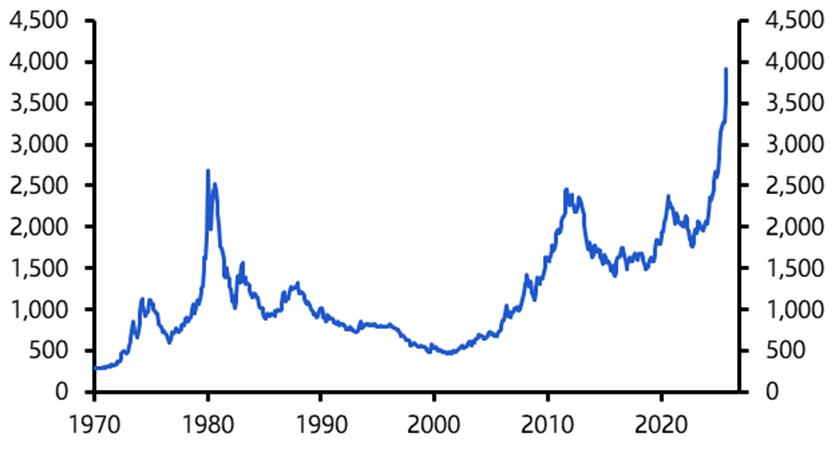
However, even after that sell-off – which included the biggest one-day fall in over a decade – gold is still at a record high in inflation-adjusted terms. (See Chart 1.) The run-up in prices over summer has prompted many forecasters to lift their gold projections, even as the rally becomes harder to justify.
|
Chart 1: Monthly Real Gold Price (2024 US$ per Ounce)
Sources: CEIC, Capital Economics |
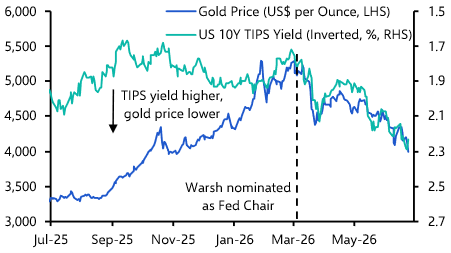
Until recently, it had been possible to account for shifts in the price of gold in macroeconomic terms. The metal tended to move inversely with real yields on US government bonds – that is to say, the yield investors earn on Treasuries after adjusting for inflation.
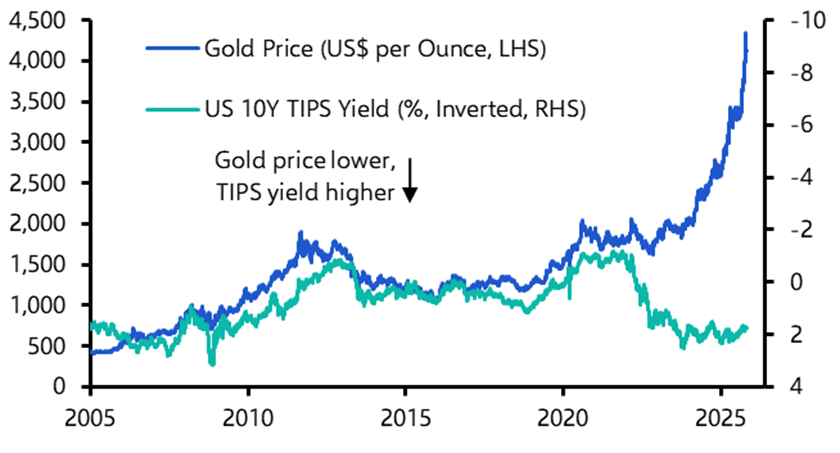
The logic that underpinned this relationship was straightforward: gold pays no income, so when real yields increase, the opportunity cost of holding it increases and so its price falls; conversely, when real yields drop, that cost diminishes and gold looks more attractive. However, while this relationship held reasonably well for most of the past decade, it broke down in 2022. (See Chart 2.) Since then, gold prices have been marching higher even as real yields have risen, suggesting that other forces have been at work.
|
Chart 2: Gold Price and 10-Year TIPS Yield Sources: CEIC, Capital Economics |
Two broad explanations have typically been offered to justify this year’s price surge. The first centres on official demand and involves central banks – particularly in emerging markets – buying gold to diversify their reserves away from the dollar.
This behaviour can be seen most clearly with the People’s Bank of China, whose official holdings of US Treasury securities have fallen from over $1 trillion in 2020 to around $700 billion today.
The freezing of Russia’s reserve assets by Western governments following its invasion of Ukraine in 2022 was a teachable moment for policymakers on the other side of the geopolitical divide. They have come to see gold as a “sanction-proof” store of value, and this has resulted in a structural shift in demand from these institutional sources.
The second apparent driver of this year’s rally in gold has been the so-called “debasement trade” – the idea that political turmoil, particularly in Washington but also in other major economies such as France and Japan, has prompted investors to seek refuge from fiat currencies.
A common explanation for the surge in hard assets such as gold and silver is that political strains in the US – including concerns over challenges to the Federal Reserve’s independence – could stoke inflation and weaken the dollar. Dubbed the “debasement trade,” rallies in the prices of these assets are seen as a hedge against the erosion of purchasing power.
These sound like plausible explanations, but they don’t provide a satisfactory account of the scale of this year’s increase in the gold price. Increased central bank appetite has been a consistent theme since 2022. While it may have helped put a firmer floor under gold prices, this demand doesn’t account for the roughly 30% surge from late summer to last week’s drop.
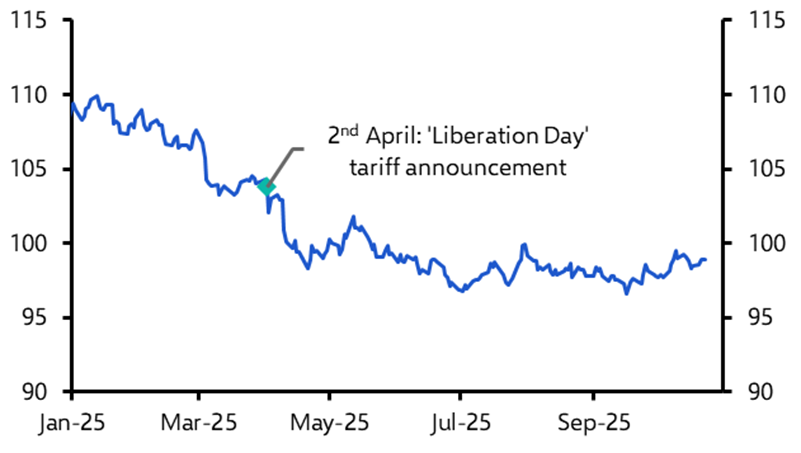
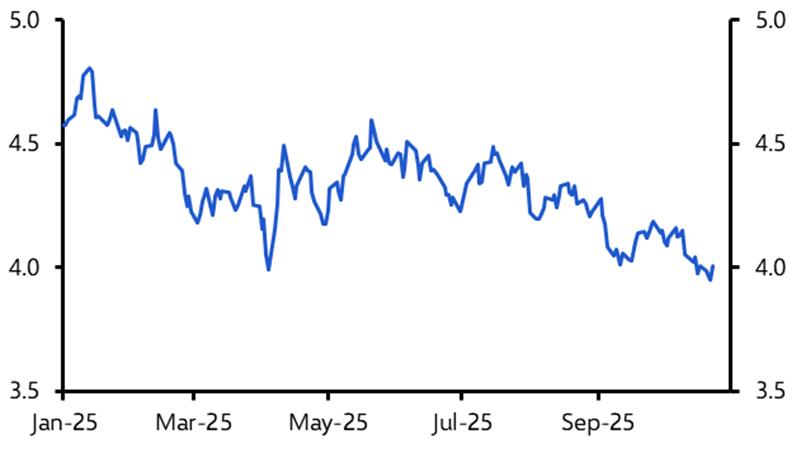
The idea that a debasement trade is driving the price of gold simply doesn’t stand up to the evidence. After the initial sell-off following April’s ‘Liberation Day’ tariff announcement from the Rose Garden, the dollar has been relatively stable for months while US Treasury bond yields have been trending downward all year – precisely the opposite of what you would expect if investors were bracing for higher inflation and a weaker, or debased, currency. (See Chart 3 & 4.)
|
Chart 3: DXY US Dollar Index
Sources: LSEG, CPB, Capital Economics |
|
Chart 4: US 10-Year Treasury Yield (%)
Sources: CEIC, Capital Economics |
Perhaps gold investors are anticipating inflation or dollar weakness that hasn’t yet shown up elsewhere. Jerome Powell’s chairmanship of the Federal Reserve ends in May, and the succession could be seen as a potential flashpoint. But even if the next Fed chair is more dovish, it’s hard to see their tenure as the beginning of a new, inflationary chapter in US monetary history.
Likewise, while we expect heavily indebted governments to rely on financial repression to manage their debt burdens, this is likely to take relatively mild forms – such as easing regulations to boost demand for their bonds – rather than deliberate efforts to inflate away the debt’s real value.
And it would be odd, to say the least, for gold investors to be pricing in a policy shift that the vastly larger bond market appears to be ignoring.
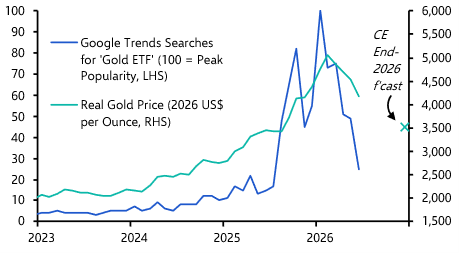
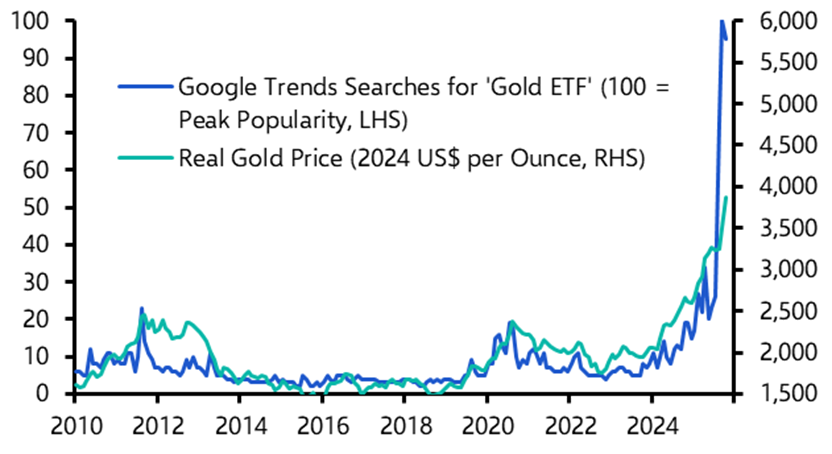
A more plausible explanation is that what began as a rise justified by the fundamentals – that structural increase in official demand – took on a momentum of its own. The surge in gold prices appears to have been increasingly driven by retail investor participation, with a striking correlation between real gold prices and Google searches for “gold ETF” (a proxy for retail demand). (See Chart 5.) It has looked more like a market gripped by FOMO (the fear of missing out) than one grounded in fundamentals.
|
Chart 5: Google Trends Searches for ‘Gold ETF’ and Monthly Real Gold Price
Sources: LSEG, CPB, Capital Economics |
Spotting bubbles is never an exact science, though when it looks and acts like one, it probably is. There have been two previous episodes of similar exuberance since the end of the Bretton Woods agreement that fixed the gold to the dollar: in the late 1970s and again in the early 2010s. Both ended the same way – with major falls in the price of gold. In the early 1980s gold fell 60% in real terms and in the mid-2010s by about 40% in real terms. (See Chart 1, again.)
Central bank demand and geopolitical tensions may cushion the downside this time round. There are good reasons to justify a structural increase in gold prices. But this past week’s price action has been a signal that gold has run ahead of itself.
Forecasting short-term moves in asset prices is a fool’s errand, but over the next 12 to 18 months the next big move in gold looks more likely to be down than up. Concerns about a debased dollar appear equally overstated.
Related content
Our most recent Canada Weekly put the latest flare-up in US–Canada trade talks in context and assessed the feasibility of Mark Carney’s goal of doubling non-US exports.
Deliberations over the next Five-Year Plan indicate that Chinese policymakers intend to maintain a supply-side focus, with limited appetite for measures that would meaningfully rebalance the economy.
The US government shutdown could yet become the longest on record, but it’s unlikely to drag on much beyond early November, says Chief North America Economist Paul Ashworth in his latest take on the economic and policy fallout.