Our Economists Recommend
The latest key insight, in-depth analysis and thematic research collections


China Economics
Our China coverage provides detailed analysis, independent forecasts, and economic outlooks for China’s economy and financial markets. We offer rapid responses to new data and developments, along with in-depth coverage of key themes, current trends, and future economic dynamics.
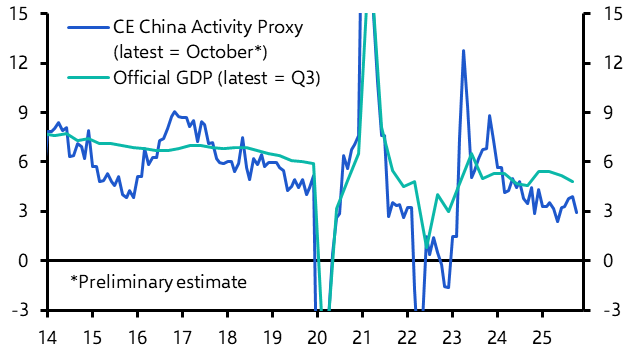
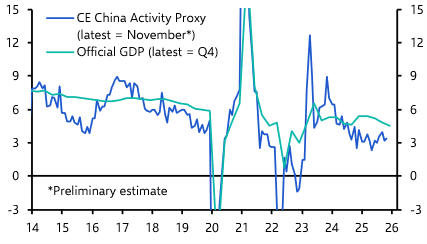
China Activity Proxy: What official GDP data isn’t telling you about the China growth story
Capital Economics’ independent indicator gives decision-makers a more accurate, more timely view of what's happening in the Chinese economy without the noise of official GDP numbers.
This service benefits from the expertise of economists based in both Singapore and London who speak and read Chinese, allowing us to respond rapidly to developments whenever they occur. In addition to the usual suite of analytical publications, the service includes our proprietary China Activity Proxy.
The subscription to this service includes around 3-4 emailed publications a week, access to our online research archive and our economists, and the opportunity to attend our conferences, forums and webinars.
- Insights from a proven team of China experts based in Singapore and London.
- Access to proprietary indicators that reveal what is really happening in China.
- Rapid responses to events and non-consensus, big-picture analysis.
凯投宏观(Capital Economics)是全球领先的独立经济研究公司。我们团队拥有超过60位资深经济学专家,分别在伦敦、纽约、多伦多、悉尼和新加坡设有分公司,提供一流的宏观经济、金融市场分析,走势预测和咨询。自1999年创建起,我们以独到的见解和分析在业界享有盛名,建立了一个杰出多元的客户群体。我们的大部分客户来自金融行业,其中不乏全球投资银行巨头,资产管理机构和众多中小型专业机构。同时,越来越多来自更广泛行业的企业客户,发达和新型经济体的政府和中央银行也与我们建立了合作关系。

China in data
Explore and download key China data coupled with our forecasts with this interactive Dashboard.
Read a sample of our China Economic Outlook
Download the key takeaways from our client report to learn about the most important issues facing China’s outlook
Key Regular Reports
The latest editions of our Weekly, Outlook, Activity Monitor & Chart Pack

Try for free
Experience the value that Capital Economics can deliver. With complimentary access to our subscription services, you can explore comprehensive economic insight, data and charting tools, and attend live virtual events hosted by our economists.
Latest China Coverage
Featured Economists
-

Mark Williams
Chief Asia Economist
Mark Williams is Chief Asia Economist at Capital Economics, leading a team of analysts based in Singapore and London. He has three decades of experience covering the region, with a particular focus on China's economy and financial markets. Mark’s work is regularly cited in the Economist, Financial Times, Wall Street Journal and New York Times. Mark and his team have developed a reputation for building innovative indicators to track important trends, including their China Activity Proxy, which has become widely followed since it was first published in 2009; more recently a gauge of tariff re-routing activity; and their Global Fracturing database that tracks how geopolitical shifts are affecting global trade and financial flows. Before joining Capital Economics, Mark was at HM Treasury in London. He has degrees in Chinese and Economics from the universities of Edinburgh and Oxford.
-

Julian Evans-Pritchard
Head of China Economics
Julian Evans-Pritchard joined Capital Economics in September 2013. Based in Singapore, Julian works with Mark Williams to cover the Chinese economy. He speaks and reads Chinese, and previously worked as a translator for Caixin, one of China’s leading financial news providers. Julian holds an undergraduate degree in mathematics and economics from the University of York and is currently pursuing a masters degree in economics at the National University of Singapore. He is a Chartered Financial Analyst and a member of the Economic Society of Singapore.
-

Zichun Huang
China Economist
Zichun Huang joined Capital Economics in May 2022 and she is a China Economist on our China service. She previously worked as an investment associate at an asset manager in Singapore and as a research fellow in Singapore Management University. She has a PhD degree in Economics from Nanyang Technological University in Singapore, and a bachelor’s degree in Financial Engineering from Huazhong University of Science and Technology in China.
-

Leah Fahy
China Economist
Leah is an economist in the China team. She joined Capital Economics in 2022 and has also covered emerging markets and the broader global economy. Her work is regularly cited by top media outlets including the Financial Times, Economist, New York Times, Wall Street Journal and Bloomberg. Leah holds an undergraduate degree in Philosophy, Politics and Economics from Oxford University and a masters in Economic History from LSE.