The aphorism “where you stand depends on where you sit” is well applied to the global economy. Beyond the value of reconnecting with clients, my trip to the Middle East and Asia last week was a reminder that debates around global macro can be too narrowly viewed through a Western lens.
That perspective can obscure important realities – and nowhere is this more evident than in how China’s role in the global economy is interpreted.
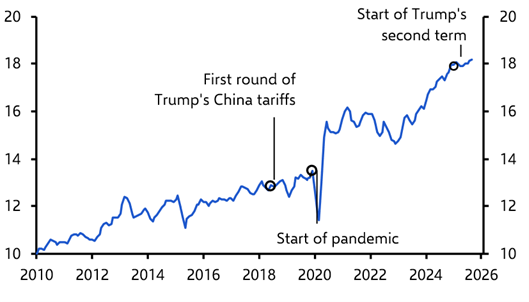
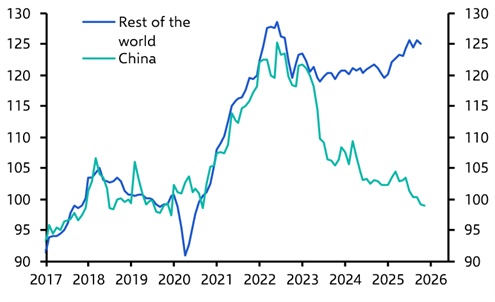
In the West, China is increasingly viewed as an acute competitive threat. Its share of global exports has risen sharply, from around 12% in 2020 to roughly 18% today. (See Chart 1.) This has coincided with a steep fall in Chinese export prices, down around 20% since 2021, while export prices elsewhere have remained broadly stable. (See Chart 2.) The result has been a powerful boost to China’s price competitiveness, underpinned by years of over-investment and excess capacity across its manufacturing sector.
|
Chart 1: China’s Share of Global Export Volumes (%, 3m average) |
|
|
|
Sources: LSEG, CPB, Capital Economics |
|
Chart 2: Goods Export Prices (USD, 2019 = 100) |
|
|
|
Sources: LSEG, Capital Economics |
This has placed intense pressure on producers in the US and especially Europe. The challenge is increasingly being framed as existential by Western producers, and is prompting a policy backlash – and not just through the US. Europe, for example, imposed tariffs on Chinese electric vehicles at the end of 2024.
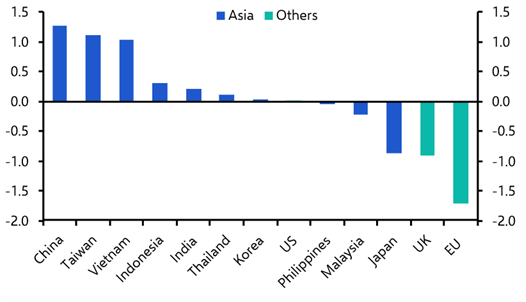
Yet this is not how developments are viewed across many parts of Asia. While European exporters have struggled, many Asian economies have seen their export share increase since 2019, with only Japan experiencing a significant decline. (See Chart 3.) Taiwan’s exports to the US have surged, driven by the AI-related investment boom there. Meanwhile, parts of South and South East Asia have benefited from firms relocating production out of China to serve US markets. The situation in Asia contrasts sharply with that of Europe, which has seen its share of global exports decline in recent years.
|
Chart 3: Global Export Market Share (%-pt change since Dec. 2019) |
|
|
|
Sources: LSEG, Capital Economics |
As a result, the focus of conversations in the region is less on China as a competitive menace to industry and more on the outlook for the economy more generally. The very price competition that is squeezing Western producers is manifesting in China as entrenched deflation, depressing nominal GDP growth and weighing on returns for investors (the government reported that growth last year was in line with its “around 5%” target – we estimate the economy is growing much more slowly).
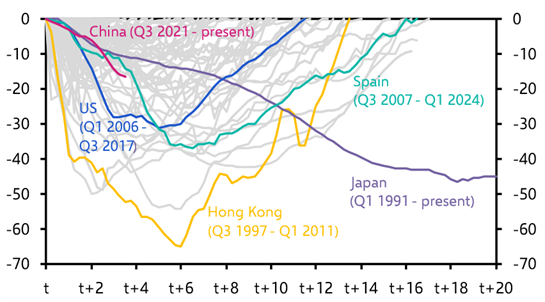
China’s deflationary problems are evident not only in manufacturing, but also in property. A recurring question during the trip was whether China’s property sector is close to turning the corner. We remain sceptical. Past housing downturns suggest the sector’s price adjustment has further to run. (See Chart 4.)
|
Chart 4: Global House Price Drawdowns (%, nominal) |
|
|
|
Note: t=2 indicates 2 years since prices started falling |
More broadly, while this year’s Five-Year Plan, due in March, may for the first time explicitly target a higher consumption share of GDP, we doubt the authorities will fully embrace the reforms required to rebalance the economy, revive growth and decisively escape deflation.
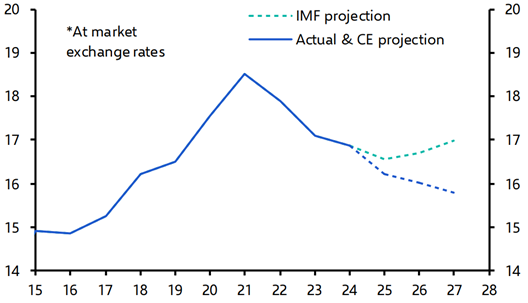
The implication is that China’s growth model is unlikely to shift materially. For the rest of the world, this means persistent weak growth and deflation in China translating into continued and intensifying export competition. China’s trade surplus is therefore more likely to rise than fall, further squeezing Western firms in global markets. Meanwhile, for China itself, and for investors in it, the environment is likely to remain deflationary. Many assume that China’s share of global GDP will stabilise or even edge higher but we expect it to continue to decline. (See Chart 5.)
|
Chart 5: China’s Share of World GDP* (%) |
|
|
|
Sources: LSEG, Capital Economics |
The risk in all of this is that it creates a world where nobody is happy – the West continues to feel squeezed by export competition from China, while the mood in China remains depressed and deflationary. It’s possible this eventually creates momentum for reform. But in today’s more fractured global environment, it is more likely to harden fault lines than heal them.
PS: The weekend’s headlines were dominated by President Trump’s threat to impose tariffs on European nations over Greenland. Read our rapid response, sent to clients yesterday, here and register to watch our online Drop-In briefing on this crisis here.
Related content
Marcel Thieliant argued that snap elections in Japan won’t result in a major fiscal loosening.
Leah Fahy outlined why China’s AI rollout could rival that of the US.
Mark Williams set out the shape of the fractured world in 2026. Clients can download the associated map and data here.