
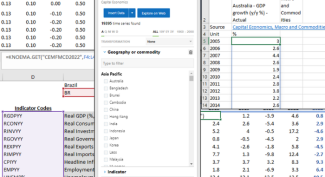
Excel add-in
The Datafinder Excel add-in provides a seamless way to download our data directly into your spreadsheets
Installation
The Excel add-in can be downloaded from the Microsoft App Store. NB: the add-in is only available for Office 2021 or later.
Excel Downloads
Get started with one of our ready-made key forecast spreadsheets or explore how the add-in works in more detail with our simple guide.
FAQ
-
Download the Datafinder Excel add-in from the Microsoft App store. NB: the add-in is only available for Office 2021 or later.
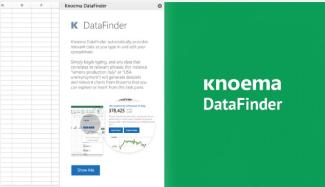
Once the add-in has installed, you will be able to find the sidebar by clicking on 'Data Finder' in the 'Data' ribbon.
-
Open up the Datafinder sidebar and click 'log in' at the bottom of the panel.
If you are logged into the Capital Economics website already then you can log into the Excel add-in by clicking on "Sign in with SSO".
You can also log in to the Excel add-in by entering the email address and password that you use to access the Capital Economics website.
-
The add-in uses an Excel formula to connect to the database and pull the data into the spreadsheet. You can either use the sidebar to insert data or use your own formulae to pull in data.
To insert data with the sidebar:
1. Open up the sidebar by clicking on 'Data Finder' in the 'Data' ribbon
2. Select a dataset
3. Make your data selection and click on 'insert data'
4. The add-in will generate the formula and download your chosen data
-
You can customise a previously-inserted formula or build one from scratch:
- The Excel formula is based on the following structure: =KNOEMA.GET(datasetid, dates, transform, optional modifier, dimensions...)
- Each dataset uses a different dataset ID. For example, the ID for the macro, markets and commodities dataset is "CEMFMCD2022"
- Dates can be inputted manually or can run off cell references. There are several date formats that can be used depending on the frequency of data available for an individual series. For example, dates could take the form "2015-2022" for an annual series, "2010Q1-2015Q4 for a quarterly series and "2006M1-2016M12" for a monthly series
- If you are building a formula from scratch in Excel then "NOAGG" should be entered in the "transform" field
- The 'modifier' lets you alter whether the data are downloaded as rows or columns: for rows input "@rows" and for columns input "@cols"
- The dimensions parameters allow the country/commodity, indicator and type dimension to be specified. Each have their own unique code, which can be found through the excel formula function on the data & charting portal. Alternatively, a complete list of data series is available on request
- If you would like the formula to download dates and the name of the data series, then you can add an "A" to "GET" so the formula starts "=KNOEMA.GETA(". This will download the data series name, units and dates
- The dimensions codes can be entered directly into the formula or can be taken from cell references
-
All the data can be refreshed using the default keyboard shortcuts in Excel to calculate worksheets. Using a Microsoft Windows machine, press "Ctrl + Alt + F9" or "Ctrl + Alt + Shift + F9".
You can refresh a single link to the database without recalculating the whole sheet or workbook by selecting the top left cell in the download array (the formula will be black in the formula bar for this cell), clicking on the formula bar and then pressing enter.
-
If you require assistance, or would like to ask about creating a spreadsheet for your specific needs, then please contact your account manager or the data & charting team at data@capitaleconomics.com