Climate Economics Outlook:
A redrawing of the emissions map
March 2023
- The lack of a global carbon pricing mechanism means that efforts to reduce greenhouse gas emissions will remain inherently sub-optimal. Nonetheless, we expect technological improvements and the rollout of renewables to help reduce global emissions over time without hindering economic growth. Whereas we forecast the world economy to be just over twice as big by 2050, our baseline view is that greenhouse gas emissions will fall by about 40% over the same period.
– David Oxley, Head of Climate Economics
- Our long-term emissions forecasts largely track the Intergovernmental Panel on Climate Change’s “intermediate” emissions scenario until 2030 and mirror the falls in the “low” scenario thereafter. Notwithstanding the huge amount of uncertainty involved in translating emissions trajectories to climate outcomes, our baseline view is broadly consistent with limiting the increase in the global average temperature to below 2°C of its pre-industrial average.
- Declines in emissions will not be uniform and the global emissions “map” will be re-drawn by 2050. There are more similarities than differences in the outlooks for developed markets, where emissions are already in decline; while we think that the US and EU will fall short of their lofty climate ambitions, we expect total emissions from these economies to fall by 40-60% between now and 2050. Meanwhile, we forecast emissions from China to peak around 2030 and to decline sharply thereafter, helped by a combination of a falling population and de-industrialisation.
- Emissions will continue to rise in parts of the developing world, notably in India where a combination of strong growth in population and living standards, and comparatively slow progress in eradicating coal use, will see it overtake China as the world’s biggest polluter in the 2040s. Meanwhile, rising populations will put strong upward pressure on emissions in a host of non-G20 countries, particularly in sub-Saharan Africa. However, the countries whose populations will expand the most account for just a tiny fraction of greenhouse gas emissions and so they will not add much to aggregate global emissions.
A re-drawing of the emissions map
- Emissions and economic activity will continue to decouple: whereas the world economy will be just over twice as big by 2050, greenhouse gas emissions will have fallen to about 63% of current levels by the same point. This is well short of “net zero” but should be enough to limit the increase in the global temperature to within 2°C of the pre-industrial average. India will become the world’s biggest polluter in the 2040s.
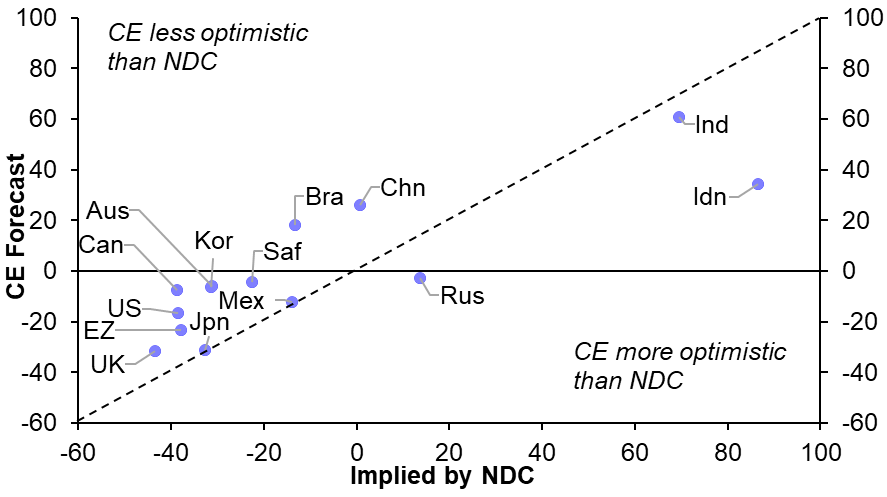
- The war in Ukraine has pushed energy security up the agenda and the challenge of “keeping the lights on” has caused some countries to put climate ambitions on the back burner. We forecast global CO2 emissions to rise by about 10% by 2030 and most countries to fall short of the cuts targeted in their Nationally Determined Contributions this decade. (See Chart 1.)
- Ultimately, though, the war in Ukraine has underlined the geopolitical benefits of renewables and we are optimistic about the ability of technology and economic incentives to help to reduce emissions; in this regard, the passing of the Inflation Reduction Act in the US last year was a major step forward and may prove to be a watershed moment.
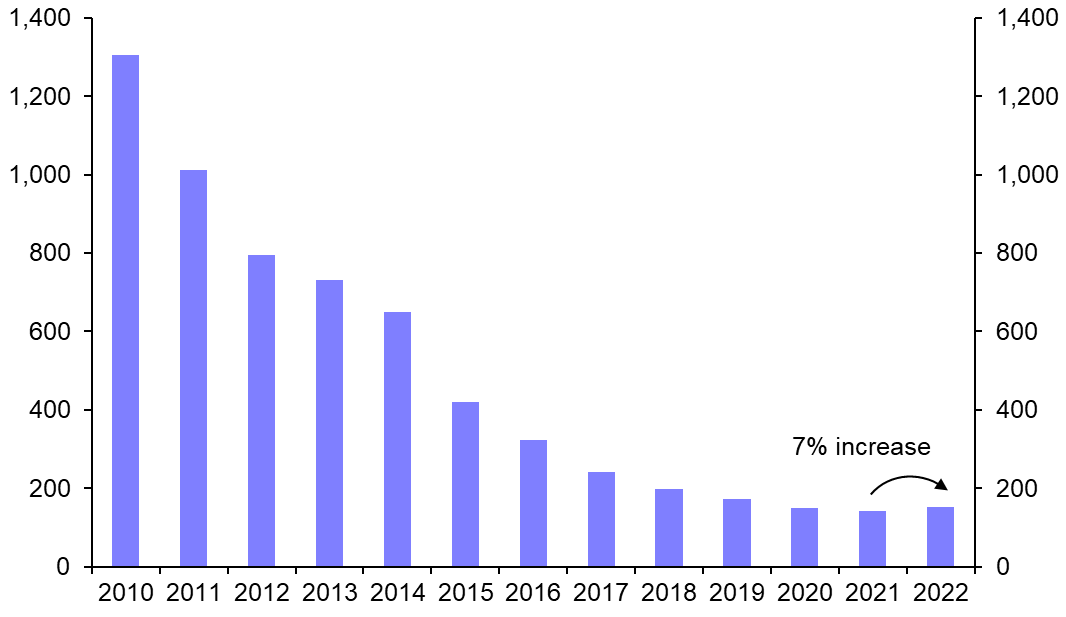
- Admittedly, a combination of higher interest rates and rising raw material prices have interrupted the long-term declines in the costs of renewables and battery power, and could push costs up further in the near term. (See Chart 2.) That said, such pressures will dissipate as policy interest rates decline and short-term supply crunches for commodities such as lithium ease, and so are unlikely to appreciably slow the pace of the green transition.
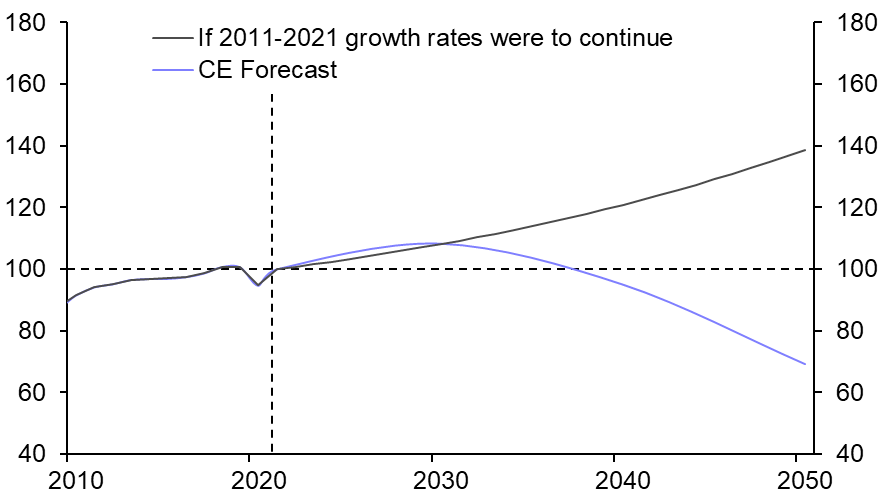
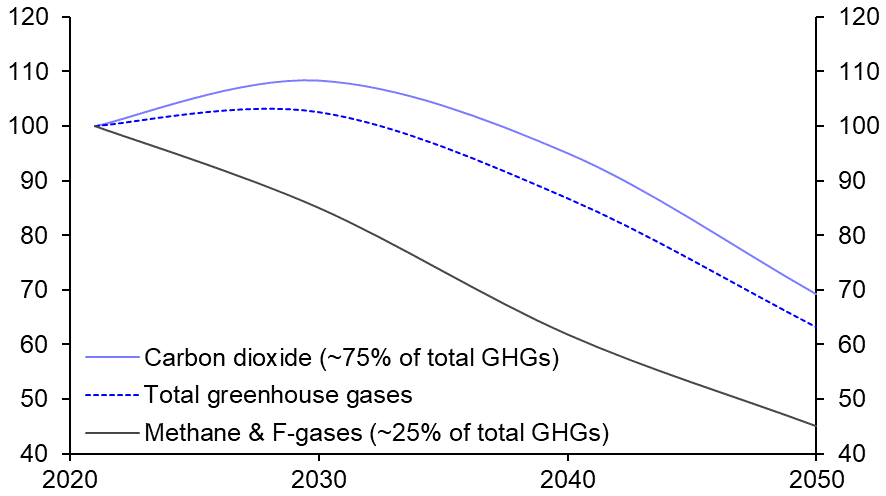
- We forecast CO2 emissions to fall by 1.3% each year on average between 2021 and 2050. This follows a decade in which emissions have grown by 0.6% per year on average and is consistent with total CO2 emissions falling from nearly 34 billion tonnes in 2021 to about 23 billion tonnes in 2050 – a fall of one third. (See Chart 3.) We expect methane and other GHG emissions to fall more quickly than CO2, mainly because it would be profitable to prevent a large chunk of methane emissions. (See here.) All told, we forecast total GHG emissions to decline by 37% by 2050. (See Chart 4.)
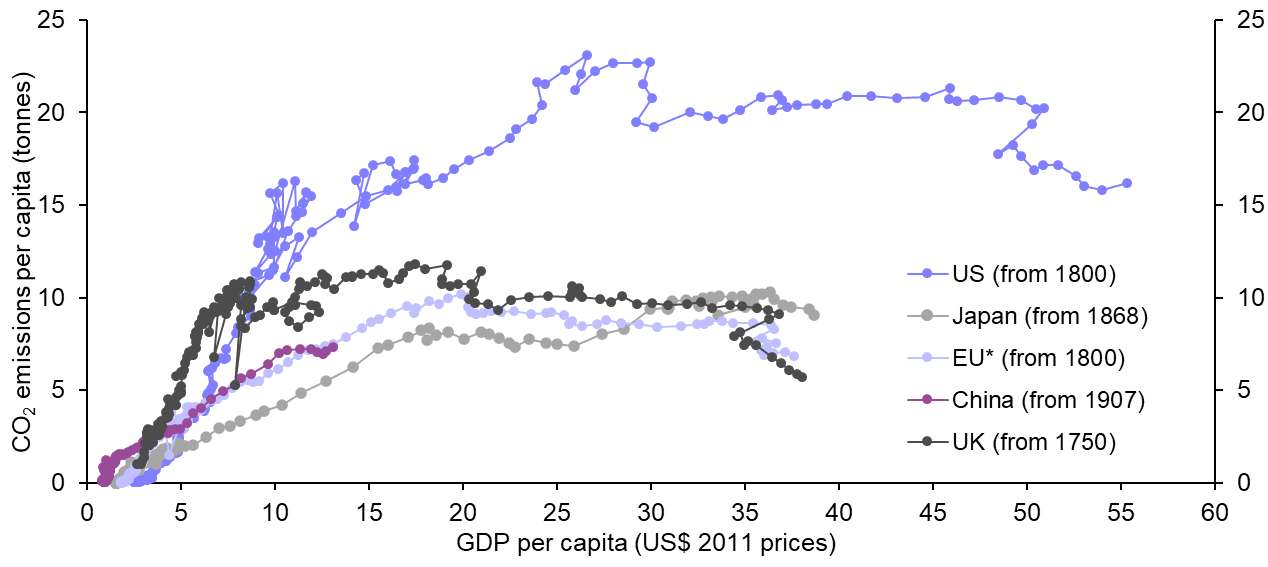
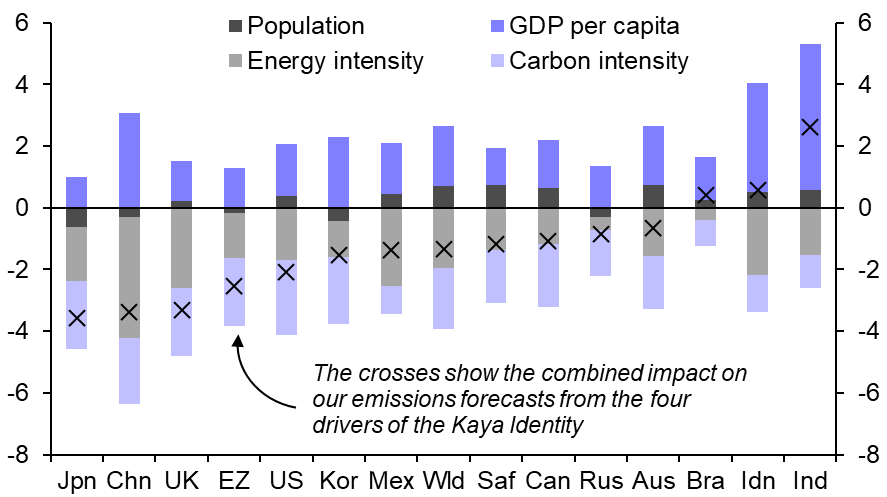
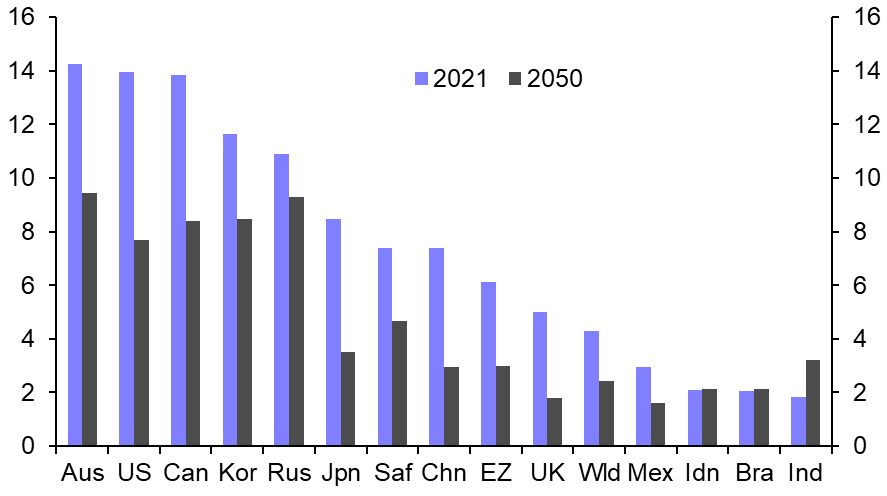
- We forecast the US and EU to both cut emissions by about half by 2050 relative to 2021. Meanwhile, we expect emissions from China to fall broadly in line with government plans over the period, helped by a falling population and de-industrialisation. In contrast, a combination of population growth and rising living standards (see Chart 5), and slow progress in eradicating coal, will see India overtake China as the world’s biggest emitter in the late 2040s. That said, in 2050, the average Indian will still emit less than half the emissions of the average American. (See Chart 6.)
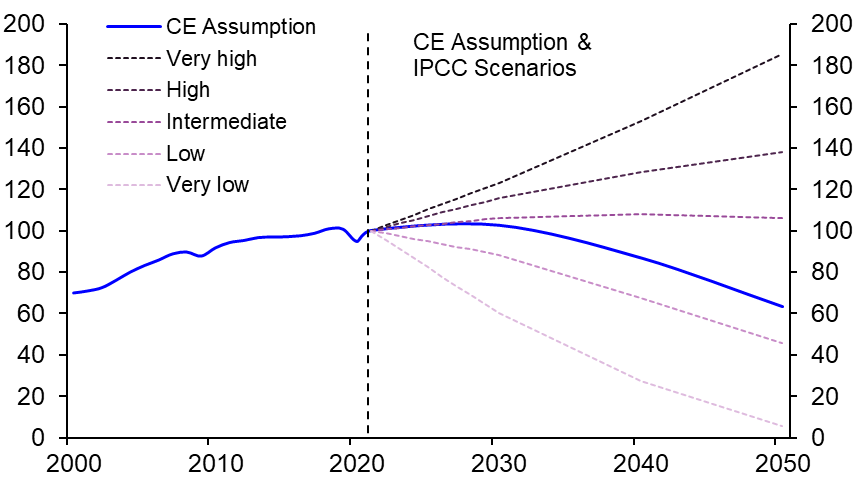
- Our forecasts for global GHG emissions largely track the Intergovernmental Panel on Climate Change’s (IPCC) “intermediate” emissions scenario until 2030 and mirror the falls in the “low” scenario thereafter. (See Chart 7.)
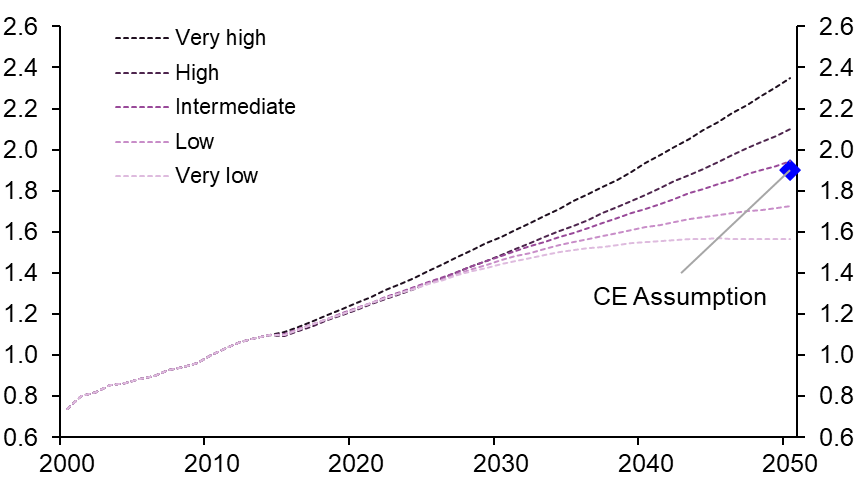
- Estimating the degree of global temperature change under different emissions scenarios is subject to a wide degree of uncertainty, not least in light of so-called tipping points. Moreover, temperature rises will not be felt uniformly across the world. Notwithstanding these caveats, based on the IPCC estimates, our emissions forecasts are broadly consistent with the global average surface temperature rising to about 1.9°C above its pre-industrial level by 2050 (see Chart 8) and stabilising close to this level between 2050 and 2100.
|
Chart 1: Change in Greenhouse Gas Emissions |
Chart 2: Lithium-ion Battery Pack Cost |
|
|
|
|
Chart 3: Global CO2 Emissions |
Chart 4: Global Greenhouse Gas Emissions |
|
|
|
|
Chart 5: CO2 Emissions & Kaya Identity Breakdown |
Chart 6: Per Capita CO2 Emissions |
|
|
|
|
Chart 7: Global Greenhouse Gas Emissions |
Chart 8: Global Average Surface Temperature Rise |
|
|
|
|
Sources: BP, Refinitiv, IPCC, Climate Action Tracker, Capital Economics |